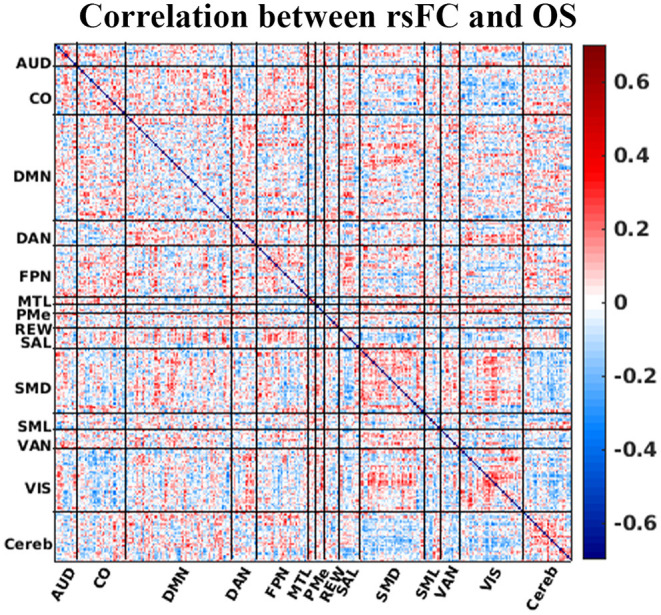
Figure 3.

Correlation between rsFC (Fisher's z transformed pairwise ROI correlation) and OS. The horizontal and vertical axis of the plot is the ROI number sorted by the resting-state network. The surface color represents the correlation between OS and ROI-to-ROI rsFC. Correlation strength between ROI pair and OS is represented by colorbar. AUD, auditory; CO, cingulo-opercular; DMN, default-mode network; DAN, dorsal attention network; FPN, frontoparietal network; MTL, medial temporal lobe; PMe, parietomedial network; REW, reward network; SAL, salience network; SMD, somatomotor dorsal network; SML, somatomotor lateral network; VAN, ventral attention network; VIS, visual network; and Cereb, cerebellum regions (all).
