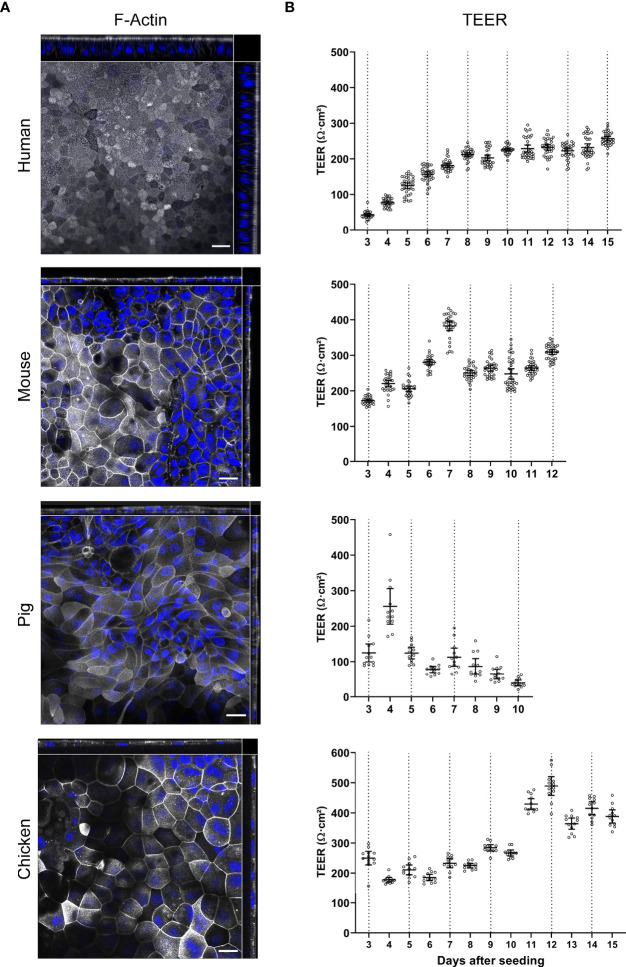
Figure 3.
Characterization of TEER development and brush border orientation of ODMs from human, mouse, pig and chicken origin. Spheroids of all four species were seeded on transwell inserts and cultured in differentiation media. (A) Representative orthogonal images of z-stacks showing F-actin accumulation in the apical brush border of ODMs. ODMs were fixed after 10 (human), 12 (mouse), 6 (pig) and 15 (chicken) days and F-actin was visualized using phalloidin (white) and nuclei using DAPI (blue). Scale bars represent 20 µm. All experiments were performed twice with similar results. (B) ODMs of all four species developed electrophysiologically tight barriers as indicated by TEER analysis. Dashed lines represent medium exchanges. Experiments show mean (± 95% CI) of 12–36 filter inserts per species.

