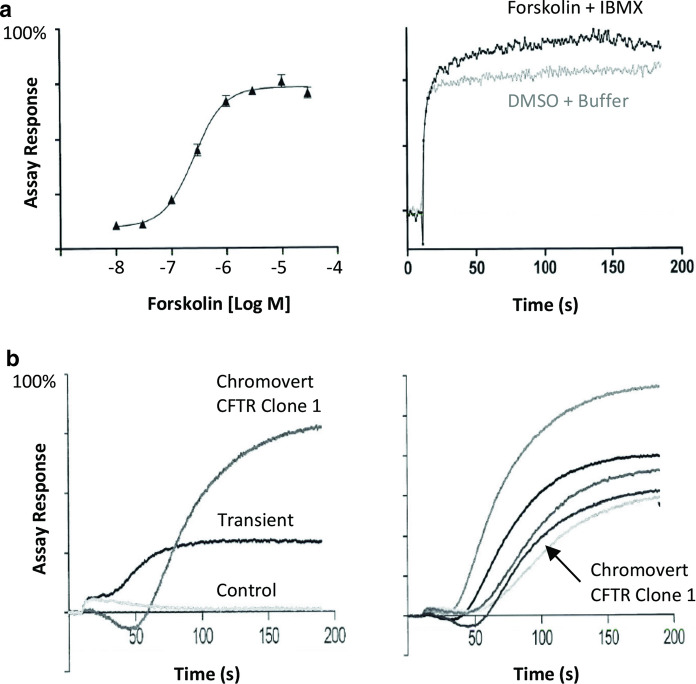
Fig. 2.
Comparison of Chromovert technology-enabled CFTR cell line to traditional results using a fluorescent membrane potential assay. a Left panel shows the dose response curve of the CFTR cell line to forskolin, resulting in an EC50 value of 256 nM. Right panel shows the response of the CFTR-Δ508 cell line to 30 µM Forskolin + 100 µM IBMX (3-isobutyl-1-methyl xanthine) versus DMSO + Buffer in the absence of any trafficking correctors. b Left panel shows the response of the one Chromovert CFTR cell line (Clone 1), cells transiently-transfected with CFTR and control-transfected cells to an EC50 concentration of Forskolin. Right panel shows the response of Clone 1 compared to additional Chromovert CFTR clonal cell line isolates

