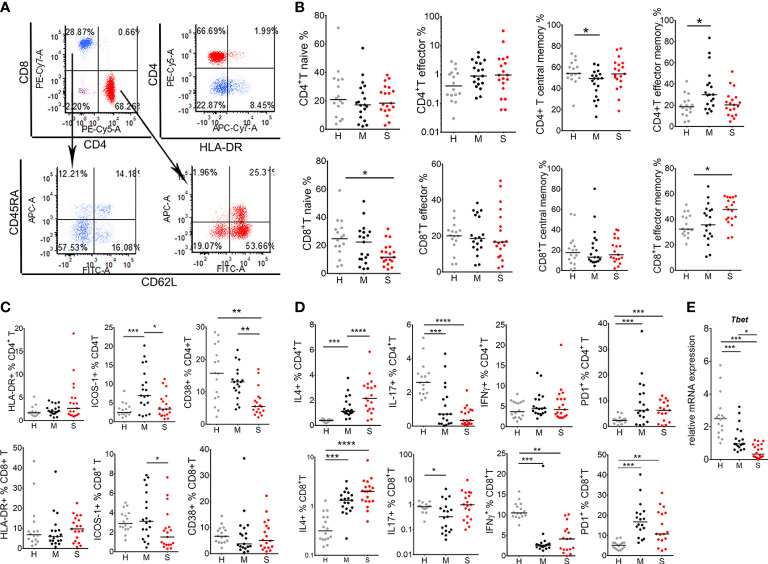
Figure 2.
T cell response in coronavirus disease (COVID)-19 patients and healthy donors. (A) Gating strategy for identification of T cell subsets is shown. After exclusion of doublets, T cells were gated from lymphocytes (CD45hiSSclow) region as CD3+CD56- cells, followed by CD4 and CD8 phenotyping. (B) The percentages of naïve (CD62L+CD45+), effector (CD62L-CD45RA+), central memory (CD62L+CD45RA-) and effector memory (CD62L-CD45RA-) T cells, gated from CD4+ T cell (red) or CD8+ T cell (blue) region as in (A), are shown as the proportion of total CD4+ or CD8+ T cells. (C) The percentages of HLA-DR+, ICOS-1+, and CD38+, and (D) IL-4+, IL-17+, IFN-γ+ and PD1+ CD4+ T, and CD8+ T cells are shown as the proportions of total CD4+T or CD8+T cells as indicated. (E) Relative mRNA expression of T-bet in PBMC is shown. (B–E) The results for each donor in the groups of healthy donors (H, n=16), mild (M, n=19) and severe (S, n=19) patients, and the corresponding medians are shown. *p < 0.05, **p < 0.01, ***p < 0.005, ****p < 0.001 as indicated (Kruskal-Wallis test with Dunn’s post-test).

