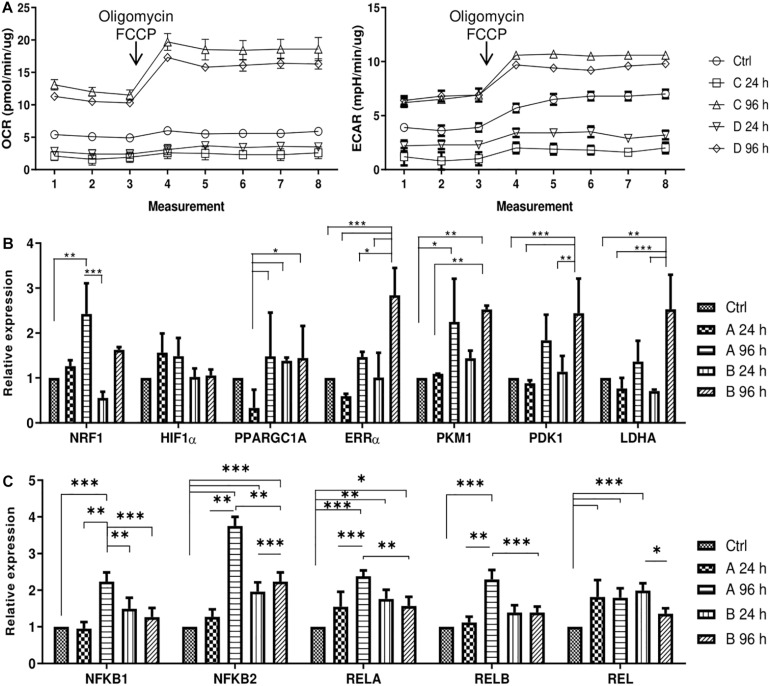
FIGURE 5.
Cell energy phenotype and metabolic alterations during treatments of small molecule combinations A and B on AFSCs. (A) Mitochondrial respiration and glycolytic activity expressed as normalized OCR and ECAR, respectively, of control and treated cells after the addition of ETC inhibitors oligomycin and FCCP. The time in the x-axis represents time points when each measurement was taken. (B) The relative expression of genes, related to cell metabolism and respiration: NRF1, HIF1α, PPARGC1A, ERRα, PKM, PDK1, and LDHA, (C) the relative expression of NF-κB family genes NFKB1, NFKB2, RELA, RELB, REL in control and treated cells as determined by using RT-qPCR. The data were normalized to GAPDH and presented as a fold change over untreated control. The data in A was obtained using Seahorse XFp Extracellular Flux Analyzer (Agilent, United States) and “Cell energy phenotype test.” Results are presented as mean ± SD. p ≤ 0.05 (*), p ≤ 0.01 (**), p ≤ 0.001 (***), where not indicated: non-significant.

