Figure 7.
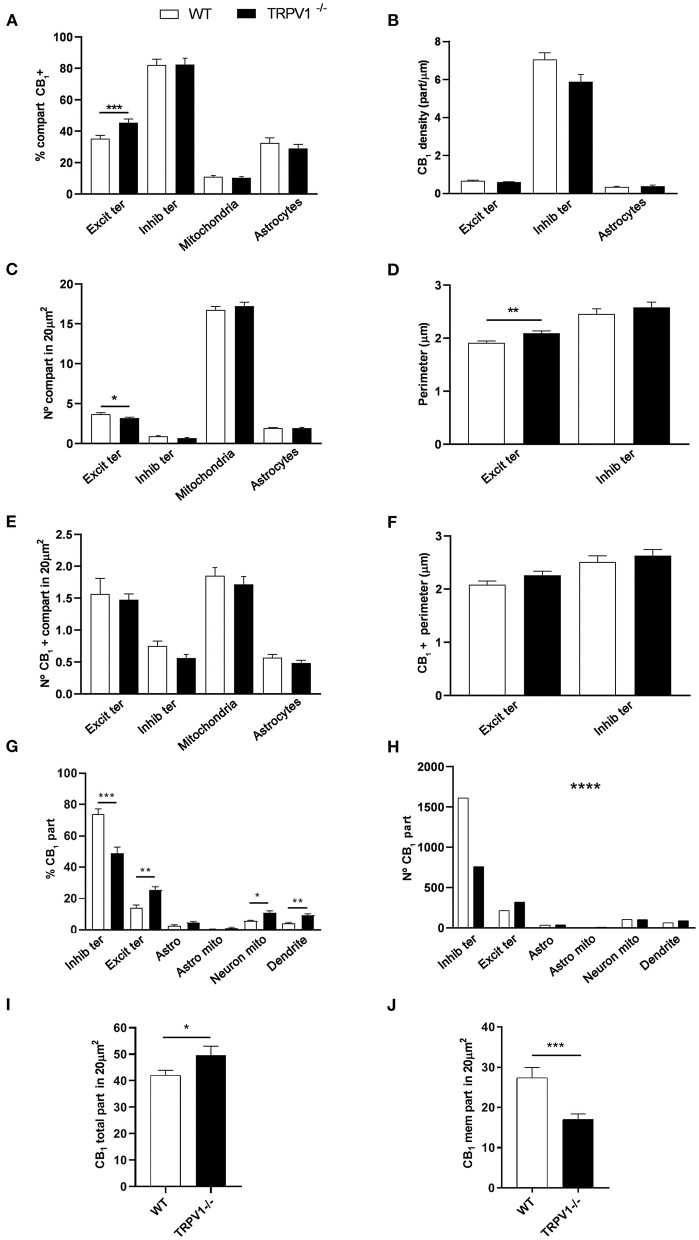
Statistical assessment of CB1R labeling in several subcellular compartments in the inner 1/3 ML of WT and TRPV1−/− mice. (A) Percentage of CB1R positive excitatory and inhibitory terminals, mitochondria and astrocytes. (B) Density of CB1R (particles/μm). (C) Number of excitatory and inhibitory terminals, mitochondria and astrocytes in 20 μm2. (D) Perimeter (μm) of synaptic terminals. (E) Number of CB1R positive excitatory and inhibitory terminals, mitochondria and astrocytes in 20 μm2. (F) Perimeter (μm) of CB1R positive synaptic terminals. Data were analyzed by non-parametric or parametric tests (Mann–Whitney U-test or Student's t-test). (G) Proportion of CB1R labeling in excitatory and inhibitory terminals, astrocytes, mitochondria (neuronal, astroglial), and dendrites normalized to the total CB1R content. (H) Number of CB1R particles in the compartments analyzed in (G). Chi square test. (I) Total number of CB1R particles in 20 μm2. (J) Number of CB1R particles found in membranes in 20 μm2. Mann–Whitney U-test or Student's t-test. p < 0.05*; p < 0.01**; p < 0.001***; p < 0.0001****. All data are represented as mean ± S.E.M.

