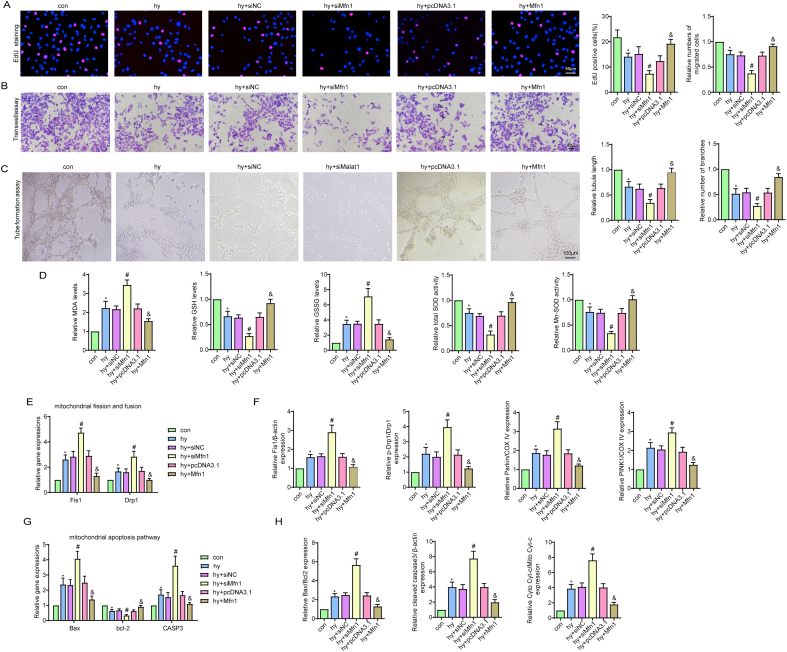
Fig. S7.
Mfn1 positively regulated CMEC proliferation, migration and inhibited oxidative stress after hypoxic injury
Cell proliferation was measured by EdU staining, and the percentage of EdU-positive CMECs (red) was quantified (A). CMEC migration ability was measured by the Transwell assay (B). Images and quantitative analysis of the tube formation assay (C). MDA content, GSH and GSSG levels, and total SOD and Mn-SOD activities of CMECs (D). Relative expression of mitochondrial fusion/fission-related genes (E). Quantification of the expression of mitochondrial fusion/fission-related proteins and mitophagy-related proteins (F). Expression of mitochondrial apoptosis-related genes (G). Quantification of the expression of apoptosis-associated proteins (H). *p < 0.05 compared with the control group, #p < 0.05 compared with the hy + siNC group, & p < 0.05 compared with the hy + pcDNA3.1 group. n = 5 in each group

