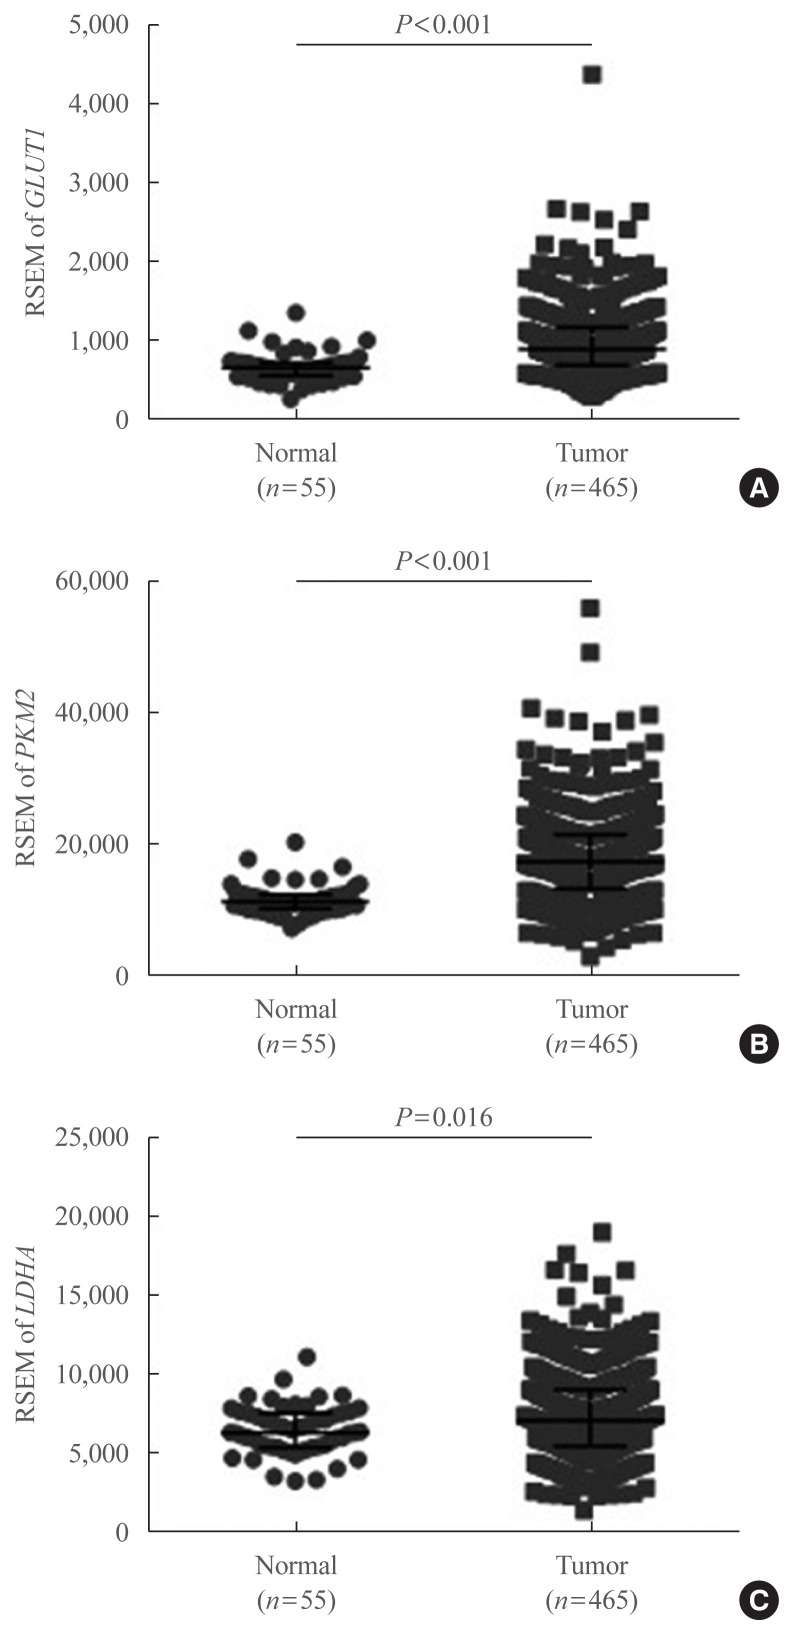
Fig. 4.
mRNA expression of glycolytic enzyme-encoding genes based on The Cancer Genome Atlas thyroid cancer database. (A) Glucose transporter 1 (GLUT1), (B) pyruvate kinase isoform M2 (PKM2), and (C) lactate dehydrogenase A (LDHA) expression levels in 465 papillary thyroid carcinoma and 55 normal thyroid tissues. Data are presented as the individual value, median, and interquartile range. RSEM, RNA-Seq by expectation-maximization.

