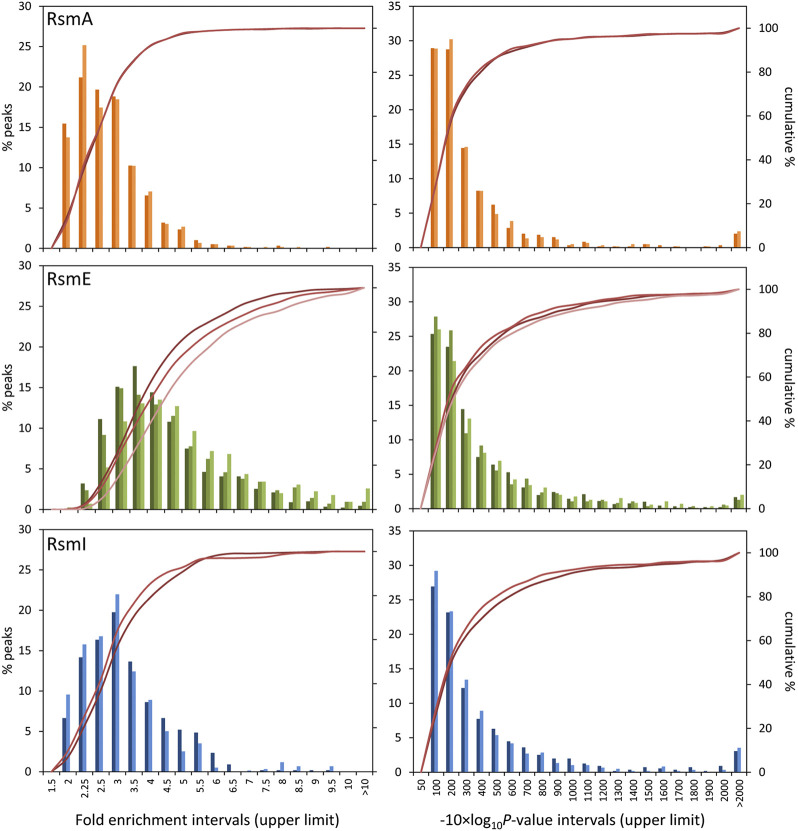
FIGURE 1.
Distribution of fold enrichment (left) and −10 × Log10(p-value) scores (right) data of overrepresented RNA sequences associated to each Rsm protein (orange, RsmA; green, RsmE; blue, RsmI) with respect to total RNA. Data were grouped in the value intervals indicated in the X-axis, where the number corresponds to the upper limit of each interval. The histograms (primary Y-axis) show the frequency of targets in each interval. The crimson lines (secondary Y-axis) correspond to the cumulative percent values. The different color intensities in the histograms and lines correspond to the different biological replicates for each protein.

