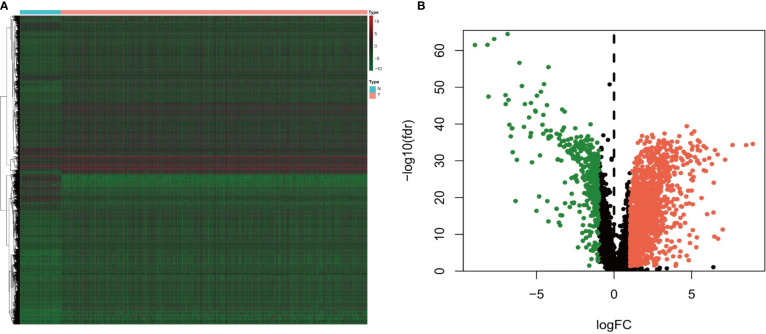
Figure 1.
(A) Heatmap and (B) volcano diagram of the Wilcoxon signed-rank test showing the differentially expressed lncRNAs between clear cell renal carcinoma and normal tissue samples. The red, green, and black dots represent the upregulated lncRNAs, downregulated lncRNAs, and no difference, respectively.

