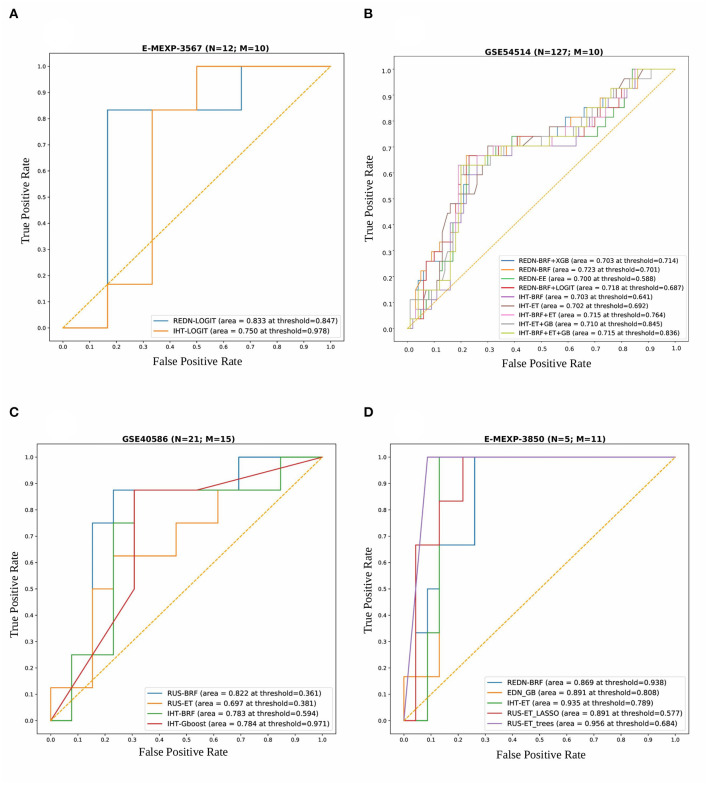
Figure 6.
Combined ROC plots illustrating the performances of various binary classifiers on four independent validation sets. “N” represents the total number of samples in each dataset and “M” represents the total number of genes used to derive the best classification models (in terms of AUROC). (A) E-MEXP-3567: The best model (AUROC=0.833) was obtained using a total of 10 out of the 20 gene biomarkers (MMP8, CEACAM8, LCN2, RETN, CLEC5A, TGFBI, CEP55, MME, OLAH, and SDC4). (B) GSE54514: The best model (AUROC = 0.723) was obtained using a total of 10 out of the 20 gene biomarkers (MMP8, CEACAM8, LCN2, RETN, CLEC5A, TGFBI, CEP55, MME, OLAH, and SDC4). (C) GSE40586: The best model (AUROC = 0.822) was obtained using a total of 15 out of the 20 gene biomarkers. (D) E-MEXP-3850: The best model (AUROC = 0.956) was obtained using a total of 11 out of the 20 gene biomarkers (MMP8, TCN1, OLAH, CEP55, PLCB1, OLFM4, HCAR3, TGFBI, MS4A3, CEACAM8, and SDC4). Due to the inherent imbalance in the training data (GSE66099) we tried different classification thresholds for the tuned classifiers and reported the ones that gave the best classification performances. The list of top performing classifiers included both individual and stacked classifiers. The legend displays the names of the sampling-classifier combinations, the AUROC and the classification thresholds that gave the top results in brackets.

