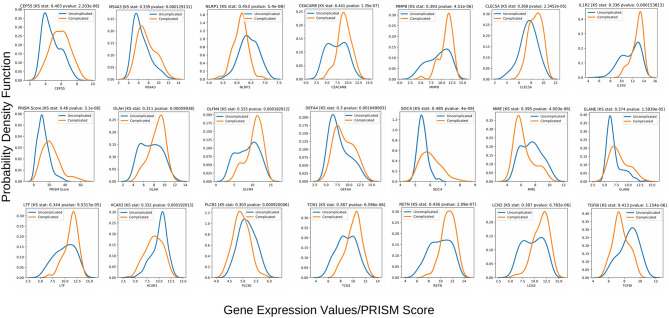
Figure 7.
Class-wise gaussian kernel density plots for the top performing variables along with the KS test scores built using the gene expression values from the 228 patients included in the derivation dataset GSE66099. The x-axis represents the gene expression values and the y-axis represents the probability density function. A Kolmogorov-Smirnov test is a non-parametric test used to compare the equality of probability distributions. There are two scores associated with a KS test: a KS statistic that is used to quantify the distance between two distributions and the p-value which tells us the significance of the result. The differences in the distribution between the complicated and uncomplicated course groups in terms of the top 20 gene predictors and a severity score (PRISM) is shown in this plot.

