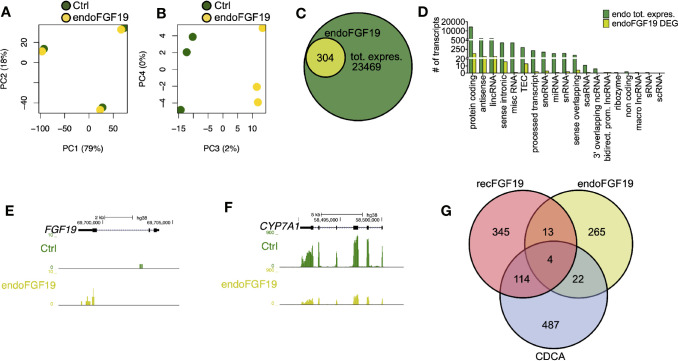
Figure 5.
Differentially expressed genes in primary human hepatocytes upon treatment with endogenously produced FGF19. Primary human hepatocytes were treated with endogenously produced FGF19 or vehicle control and total RNA was sequenced (n = 3). (A, B) Principal component analysis (PCA) showed that 97% of the variation in the samples could be explained by donor differences (PC1-2), while only 2% of the variation could be explained by the treatment (PC3-4). (C, D) A limited number of transcripts were differentially expressed upon treatment. Venn diagram (C) and bar plot (D) displaying all expressed transcripts (green) and differentially expressed transcripts after endogenously produced FGF19 treatment (yellow). The differentially expressed transcripts were not significantly enriched for any gene ontologies (GOs) or KEGG pathways. (E, F) Representative UCSC Genome Browser tracks of normalized FGF19 and CYP7A1 expression after endogenous FGF19 treatment. The tracks from top to bottom show the scale in the human genome, the location in the human genome, the gene including exons (black boxes) and introns (arrows), and the RNA-seq signal from the treatment. (G) Venn diagram displaying the overlap between differentially expressed transcripts after chenodeoxycholic acid (CDCA) (blue), recombinant FGF19 (red), or endogenously produced FGF19 (yellow) treatment compared to their respective vehicle controls. All three treatments resulted in mainly unique expressed transcripts, with little overlap among the treatments.

