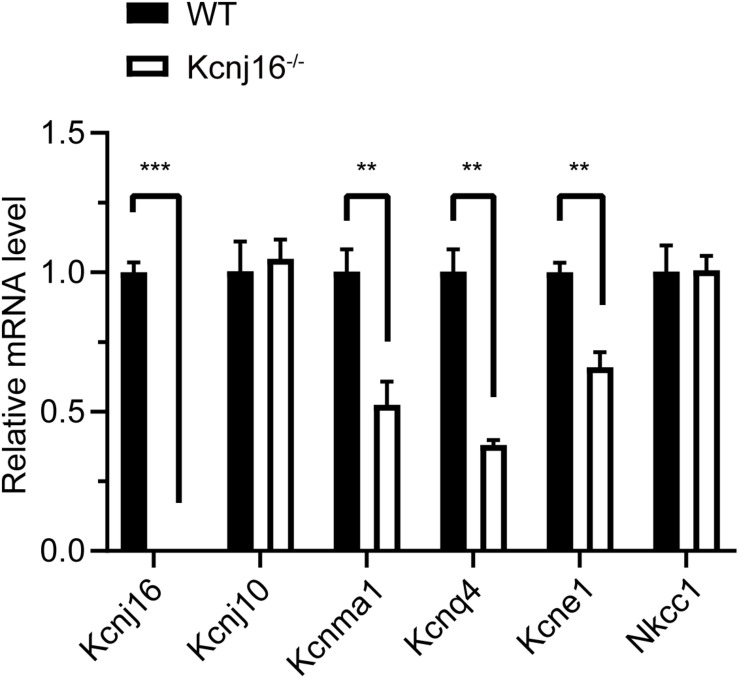
FIGURE 6.
The expression of Kcnma1, Kcnq4, and Kcne1 decreased in P30 Kcnj16− /− mice. Q-PCR was performed with P30 WT and Kcnj16− /− cochleae (p < 0.05, n = 4). Primers are shown in the Supplementary Table 2. Data are presented as the mean ± SD. **p < 0.01, ***p < 0.001, n = 4.

