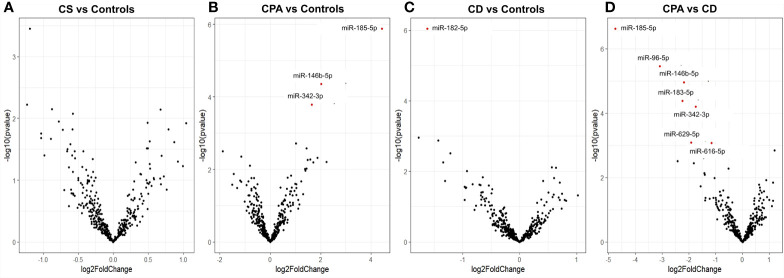
Figure 1.
Differentially expressed miRNAs from NGS of preoperative group. Volcano plot showing the relationship between fold change (log2foldchange) and statistical significance (−log10pvalue). The red points in the plot represent the differentially expressed miRNAs with FDR <0.05 considered as statistically significant. CPA, cortisol producing adenoma; CD, Cushing’s Disease, CS, Cushing syndrome represents CPA and CD, taken together. Volcano plot showing the relationship between fold change (log2foldchange) and statistical significance (-log10pvalue) for the groups CS vs Controls (A), CPA vs. Controls (B), CD vs. Controls (C), CPA vs CD (D).

