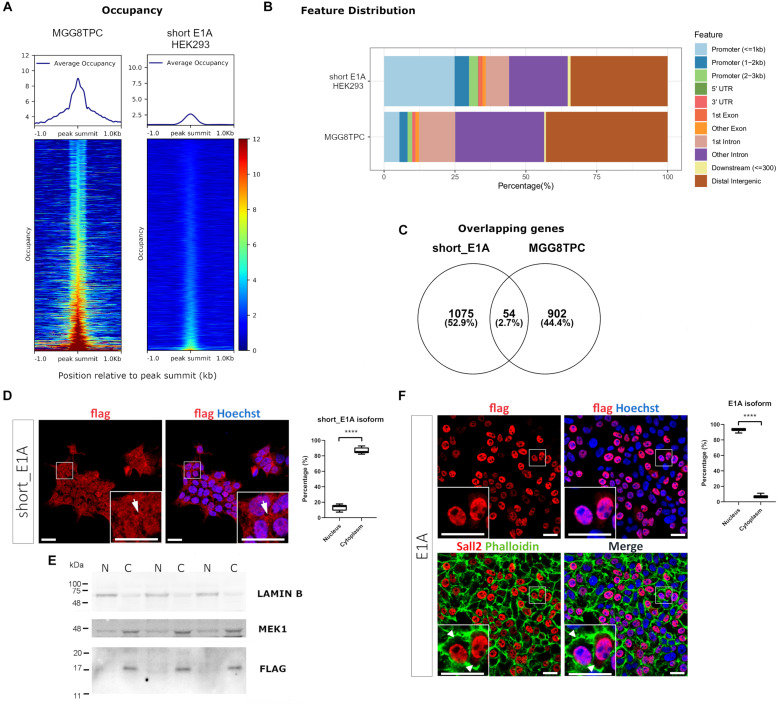
FIGURE 2.
(A) Plot of the average occupancy and heatmap of the occupancy profiling from two publicly available SALL2 ChIP-seq datasets, sorted by occupancy values from the smallest (top) to highest (bottom). Each row represents a 1-kb window focused on the peak centers in the human genome (hg19 build). (Left) Plot of 1328 peak regions from a reported in a subset of stem-like tumor-propagating cells in Glioblastoma Multiforme (MGG8TPC) SALL2 ChIP-seq using a human anti-SALL2 antibody (Bethyl Laboratories) (GEO datasets GSE54047). (Right) Plot of 1484 peak regions from a reported eGFP-short_E1A SALL2 ChIP-seq done on HEK293 cells, using an anti-GFP antibody, provided by ENCODE consortium (GEO datasets GSE105193). BigWig files used in both plots were generated using a 1x-normalized method against hg19 build, and values were plotted in the heatmaps using the same color scale for comparison purposes. (B) Feature distribution of the binding sites of these two ChIP-seq (in percentage) upstream and downstream from the TSS of genes. Promoters, UTR, and exon regions are denoted with distinctive colors. (C) Venn diagram of the overlapping peaks between the two ChIP-seq datasets. (D) (Left), immunocytochemistry of HEK 293 cells infected with Flag-SALL2 short_E1A, detected with anti-Flag and Alexa fluor-conjugated antibodies. Short_E1A (Flag) shown in red, and nuclei (Hoechst-stained) is in blue. (Right) Quantification of Flag signal between Nucleus and Cytoplasm per cell, expressed as percentages per each isoform. The T-test (****p < 0.0001) is denoted with asterisks. (E) Nucleus/Cytoplasm fractioning of Flag-SALL2 short_E1A infected HEK293 cells. LAMIN B and MEK1 proteins are markers of the nucleus (N) and cytoplasm (C). Flag detects Short_E1A. (F) (Left) Flag-SALL2 E1A long isoform is detected as in (D), phalloidin (F-actin-marker) is shown in green to denote cell boundaries since this isoform localizes mainly in the nucleus (see white arrowheads). (Right) Quantification of Flag signal between Nucleus and Cytoplasm per cell expressed in percentages as in (D). **** p < 0.0001. Magnifications in immunocytochemistry are enclosed in squares at the bottom of each image for detailed visualization purposes. White bars denote 20 μM.

