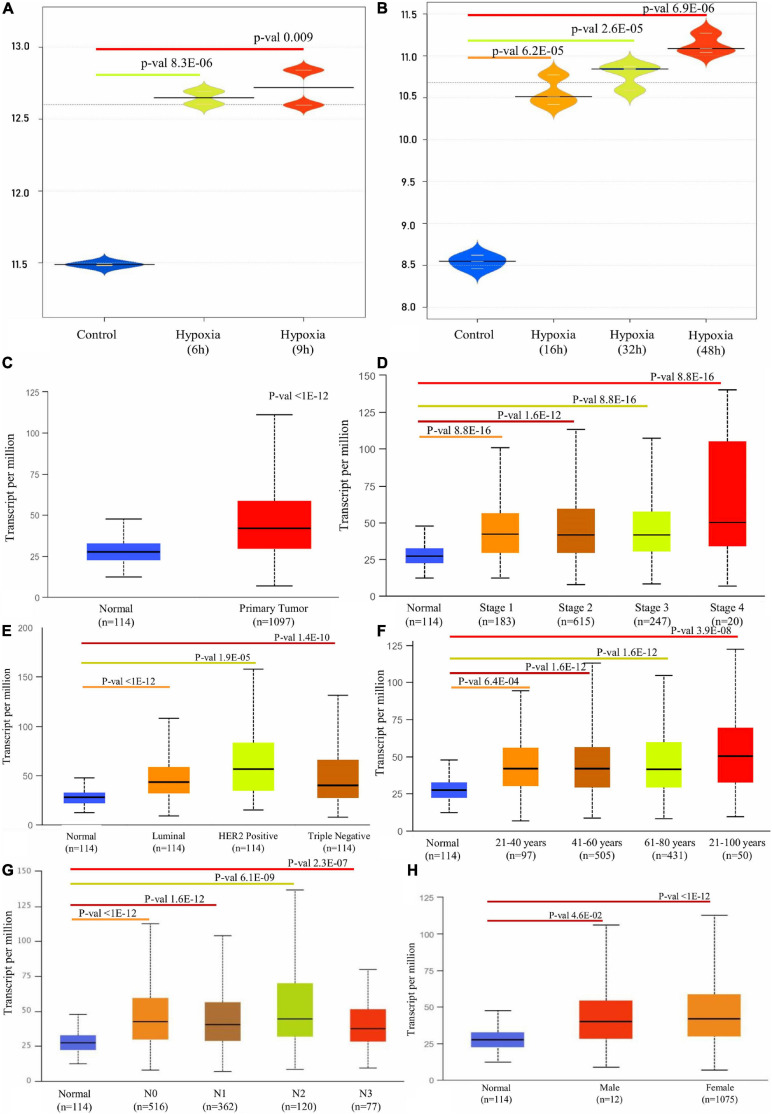
FIGURE 2.
Box plot representation of P4HA1 gene expression compared with a normal and different time period of hypoxic exposure in BC cells: cut-off p-value < 0.05. (A) GSE27813 and (B) GSE47533. (C–H) Box plot showing relative expression of P4HA1 in clinicopathologic of Breast Cancer, (C) Normal and Primary Tumor samples, (D) Normal and patients in Stages 1, 2, 3, and 4, (E) Normal and Subclass, (F) Normal and Age group, (G) Normal and Nodal subclass, and (H) Normal and Gender.

