FIGURE 3.
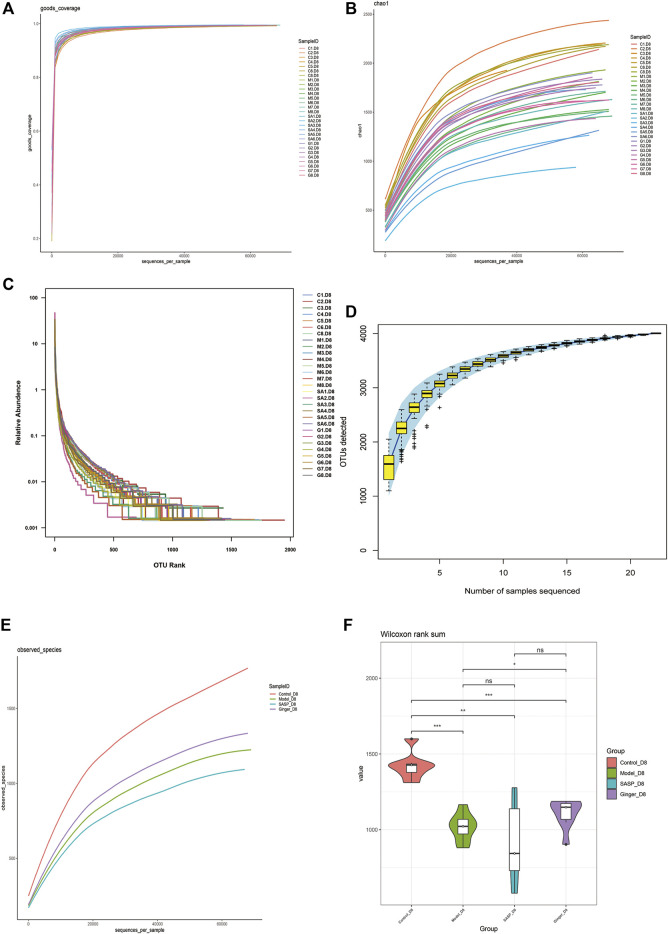
Alpha diversity index calculation statistics correct sequencing depth. (A) Goods_coverage analysis of each sample. Each curve represents a sample. The X-axis is the depth of random sampling (number of sequences sampled), and the Y-axis is the exponential value. An increase in the number of extracted sequences and the gradually flattening curve indicate that the amount of sequencing data is reasonable. (B) The chao 1 estimator. The X-axis is the depth of random sampling (number of sequences sampled), and the Y-axis is the number of OTUs. (C) Species richness and evenness of each group. On the X-axis, OTUs are sorted according to the number of sequences they contain. For example, “500” represents the 500th most abundant OTU in the sample. On the Y-axis, the relative abundance of OTU, such as “0.01”, represents 0.01%; eg, “0.1” stands for 0.1%. (D) Species accumulation curve. The X-axis represents the number of samples, and the Y-axis represents detected operational taxonomic unit (OTU) numbers. The flat curve indicates sufficient sampling. (E) The average OTUs numbers of observed species in each group. The X-axis is the depth of random sampling (number of sequences sampled), and the Y-axis is the exponential value. When the curve tends to be flat, it indicates that the amount of sequencing data is large enough to reflect most of the microbial species information in the sample. (F) Violin diagram shows alpha diversity index. The X-axis represents different groups are distinguished by different colors, and Y-axis is the index value.

