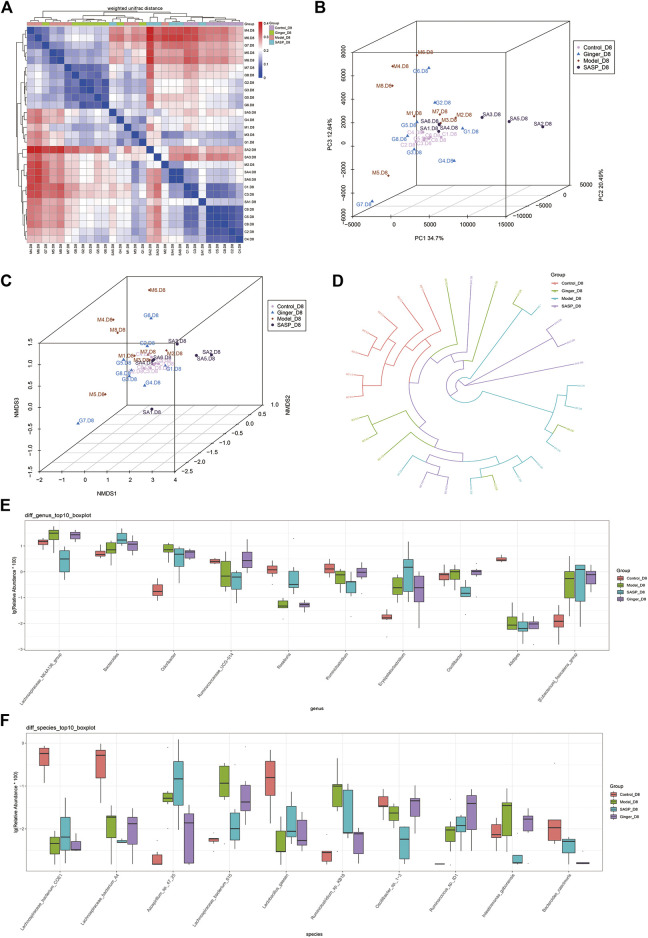
FIGURE 4.
Sequencing depth corrected and multivariate statistical analysis of microorganisms. (A) Beta diversity analysis of the variability of each group. In the heatmap (above and left), the clustering branch represents samples from different groups. The deeper the blue, the closer the two groups are. The intensity of the red color indicates the opposite. (B) PCoA represents differences between groups. The abscissa (PC1) and the ordinate (PC2) are the two main coordinates with the largest interpretation of the difference between samples. Each point in the figure represents a sample, the same color is the same group, similar samples will be clustered together, if there is a big difference between the samples, the distance will be farther in figure. (C) NMDS analysis. Each point in the figure represents a sample, the same color is the same group, similar samples will be clustered together, if there is a big difference between the samples, the distance will be farther in figure. (D) UPGMA analysis the differences between samples. Each color represents a group. The closer the branch distance, the more similar the samples. Bar boxes illustrate the relative abundance of dominant species and compared the differences within different groups in (E) genus and (F) species.

