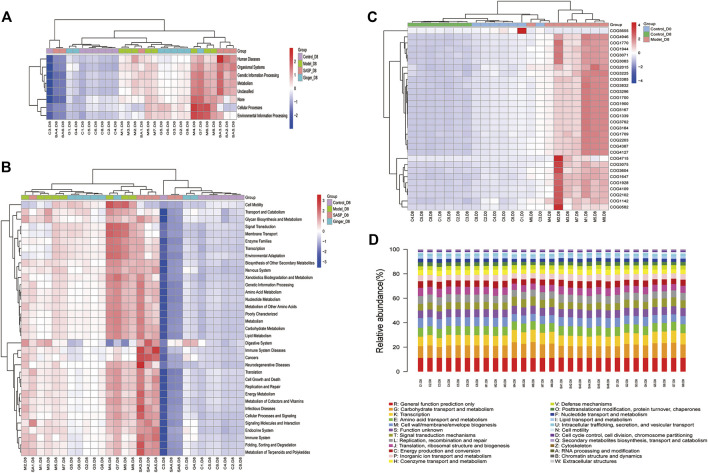
FIGURE 6.
Prediction of the functional composition of the gut microbiome. (A) and (B) Kruskal–Wallis analysis was performed to predict functions (A) and pathways (B) the different microbiome species related. The results are shown as a heatmap. (C) Clusters of Orthologous Groups of proteins were predicted and shown in the heatmap. The cluster tree on the left represents the clustering of different metabolic pathways, and the above-clustering branch represents samples from different groups (D) COG bar plot predicted the microbiome function; the x-axis is sample name and the Y-axis is relative abundance of predicted COG_category.

