
Figure 2.
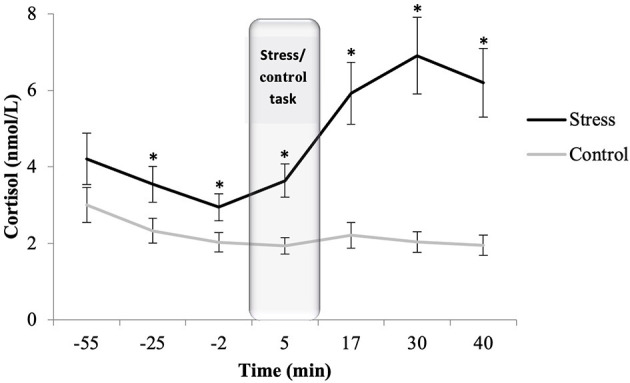
Salivary cortisol concentrations for stress (n = 27) and control (n = 32) conditions. Depicted values are means and error bars represent the SEM of raw cortisol values (*p < 0.020).
Official websites use .gov
A
.gov website belongs to an official
government organization in the United States.
Secure .gov websites use HTTPS
A lock (
) or https:// means you've safely
connected to the .gov website. Share sensitive
information only on official, secure websites.
Salivary cortisol concentrations for stress (n = 27) and control (n = 32) conditions. Depicted values are means and error bars represent the SEM of raw cortisol values (*p < 0.020).