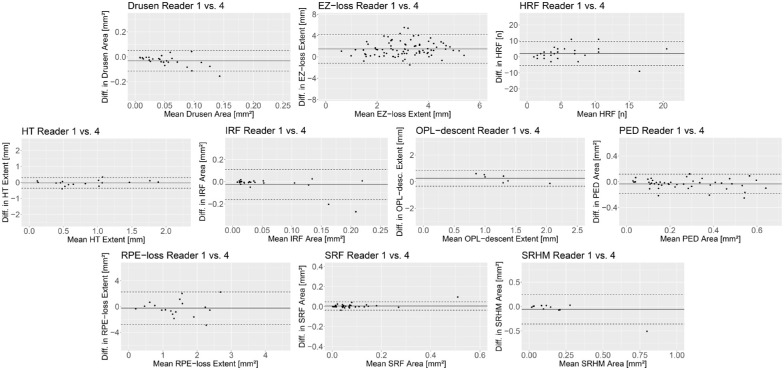
Figure 2.
Interreader agreement. The Bland–Altman plots demonstrate the interreader agreement between two exemplary readers (readers 1 and 4) for measures of drusen, EZ loss, intraretinal HRF, HT, IRF, OPL descent, PED, RPE loss, SRF, and SRHM. The measurement differences (diff.) are plotted against their mean. The solid line indicates the mean difference and the dashed lines indicate the 95% limits of agreement. There were no systematic differences between the readers. Bland–Altman plots for the interreader agreement between each pair of all readers can be found in Supplementary Figures S2 to S11.

