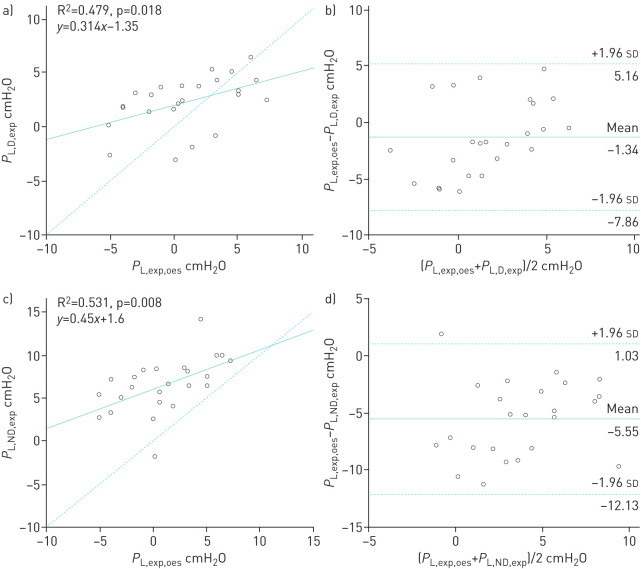
FIGURE 6.
a, c) Correlations and b, d) Bland–Altman analysis between transpulmonary pressures calculated using a, b) dependent and c, d) nondependent pleural pressure during end-expiration. a, c, e) Dashed line represents the identity line. b, d, f) Solid and dashed lines represent mean±1.96 sd of the differences. Each circle represents a different patient.

