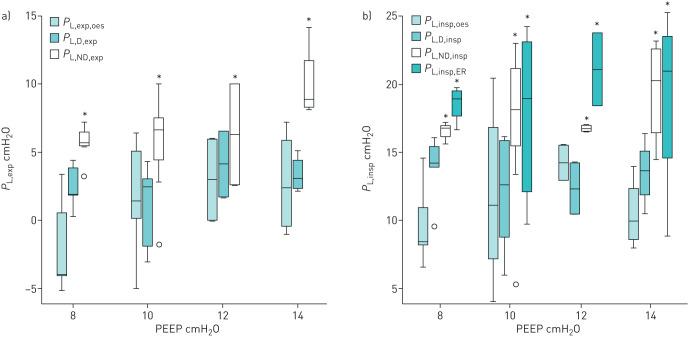
FIGURE 7.
Relationship of transpulmonary pressures calculated from oesophageal pressure and pleural pressures in mechanically ventilated human lung transplant recipients during a) expiratory time and b) inspiratory time at different positive end-expiratory pressure (PEEP) levels. *: p<0.05 compared with Poes and the dependent catheter by the post hoc Bonferroni test. Boxes represent median and interquartile range; whiskers represent minimum–maximum range. Outliers are represented by circles. See Methods for definitions and calculations.

