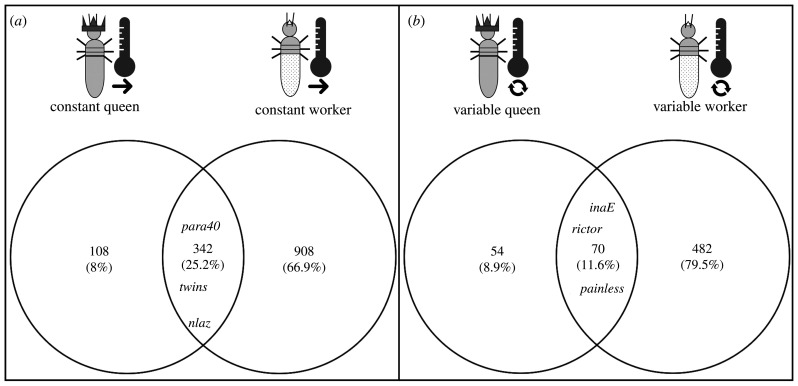
Figure 4.
Temperature-associated differentially expressed genes (DEGs) shared between queens and workers. The Venn diagrams show the number of DEGs that were upregulated in both castes (a) under constant (thermometer with a simple arrow) and (b) under variable conditions (thermometer with a circular arrow), highlighting some striking genes. Consistently across castes, 342 DEGs were upregulated under constant conditions and 70 DEGs under variable conditions.

