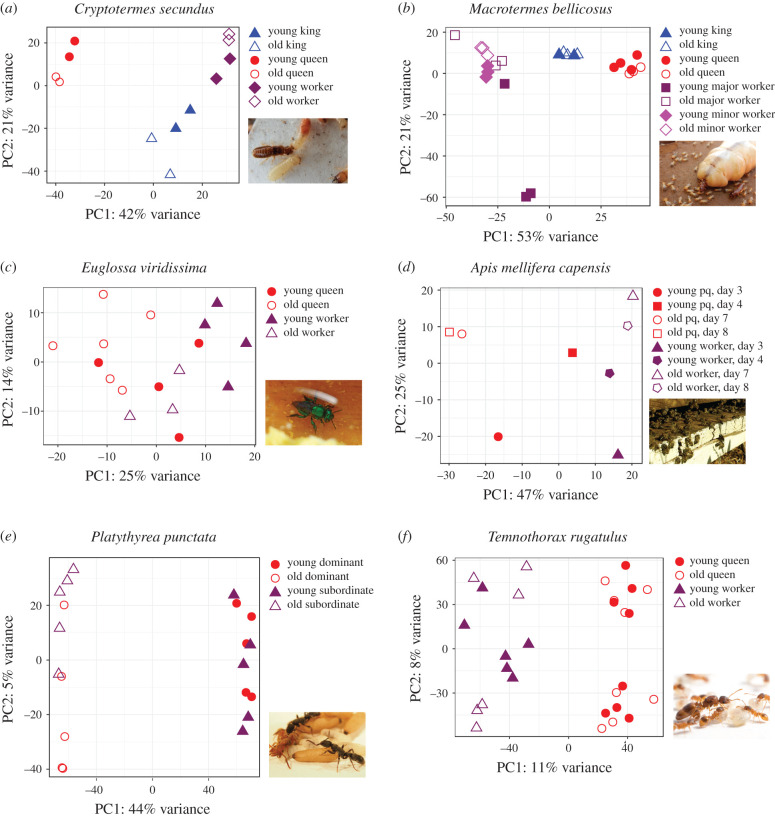
Figure 2.
Results of PCAs of variance-stabilized RNA read counts of young and old individuals. Shown are the first (x-axis) and second (y-axis) PCs with variance explained by each PC. Each point represents the expression profile of one individual/sample for 500 genes/transcripts. Filled shapes represent young and unfilled shapes old individuals: (a) the termite C. secundus (photo: J. Korb), (b) the termite M. bellicosus (photo: J. Korb), (c) the bee E. viridissima (photo: A. C. Séguret), (d) the bee A. mellifera capensis, pq: pseudo-queens (photo: V. Dietemann), (e) the ant P. punctata (head samples) (photo: A. Bernadou) and (f) the ant T. rugatulus (fat body samples) (photo: R. Libbrecht). (Online version in colour.)

