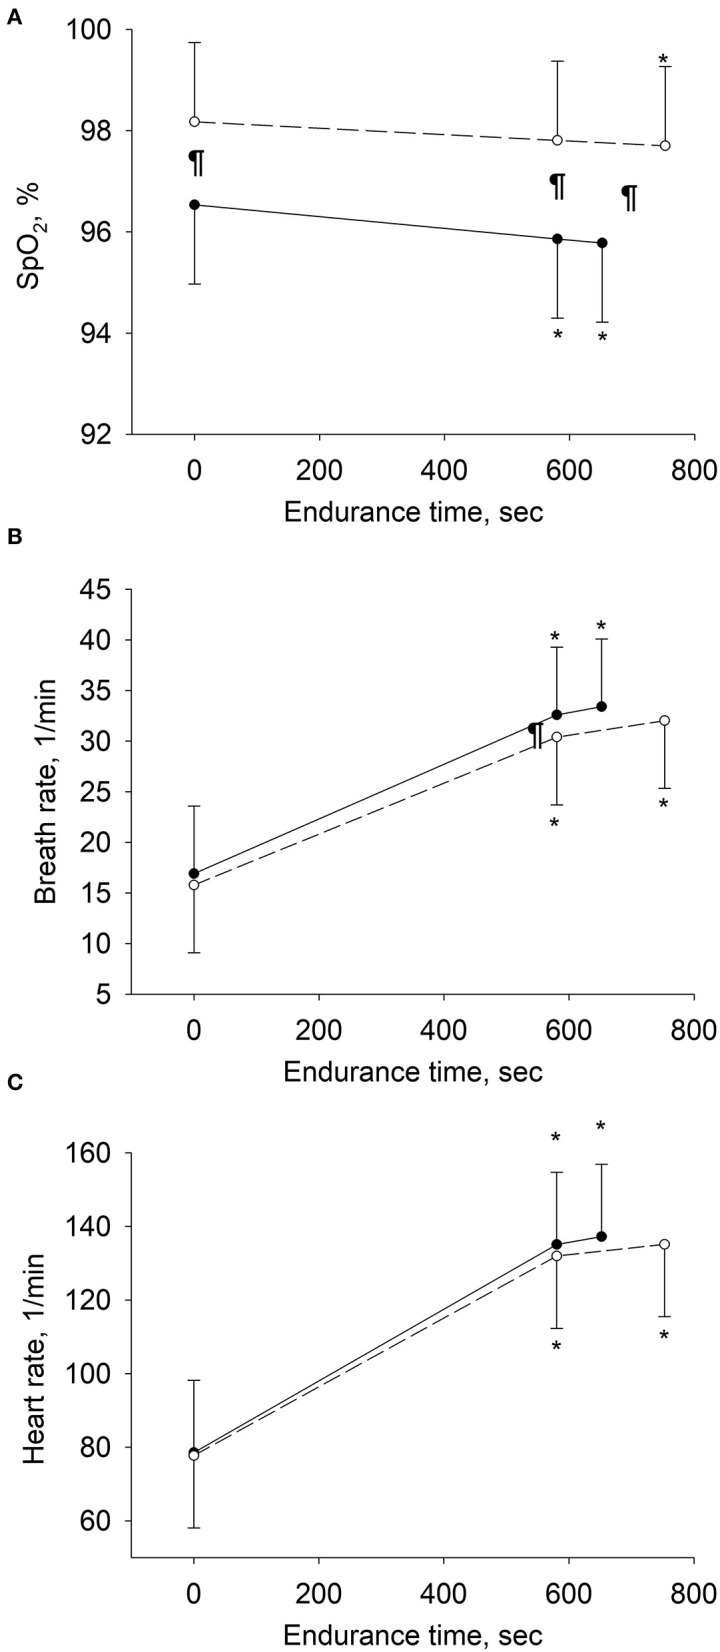
Figure 3.

Changes in physiologic variables over the course of exercise in per-protocol analyses. Means and SD bars are shown for values at rest, at isotime (i.e., end-exercise time in tests with shorter endurance and corresponding time in tests with longer endurance), and at end-exercise. Open circles represent tests with high-flow, closed circles with low-flow oxygen therapy. (A–C) Depict pulse oximetry (SpO2), breath rate and heart rate. *P < 0.05 vs. rest within same treatment, ¶P < 0.05 high-flow vs. low-flow oxygen therapy at corresponding stage of exercise.
