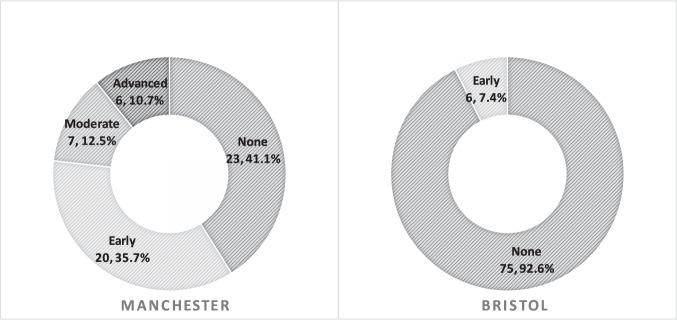
Fig. 2. Stage of glaucoma-related visual field loss.
This figure shows the stage of glaucoma related visual field loss in the eye with the best visual field (N, %) using a simplified Hoddap-Parrish-Anderson criteria (where early is mean deviation < −6 dB, moderate is mean deviation ≥ −6 and < −12 dB and severe is mean deviation ≥ −12 dB).

