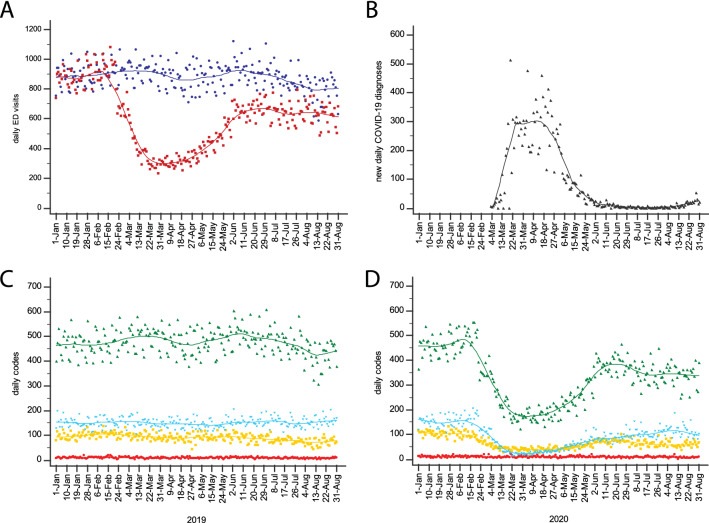
Fig. 1.
a Daily number of ED visits in 2020 (red) and 2019 (blue), from 1st January to 31st August. b Number of new daily diagnoses of COVID-19 in the Torino province, in 2020. c Daily number of red (most urgent/critical; red dots/line), yellow (urgent for evolutive risk; yellow dots/line) green (non-urgent, deferrable; green dots/line) and white codes (least urgent, deferrable to ambulatory clinic; light blue), in 2019. d Daily number of red, yellow, green and white codes, in 2020 (Color figure online)

