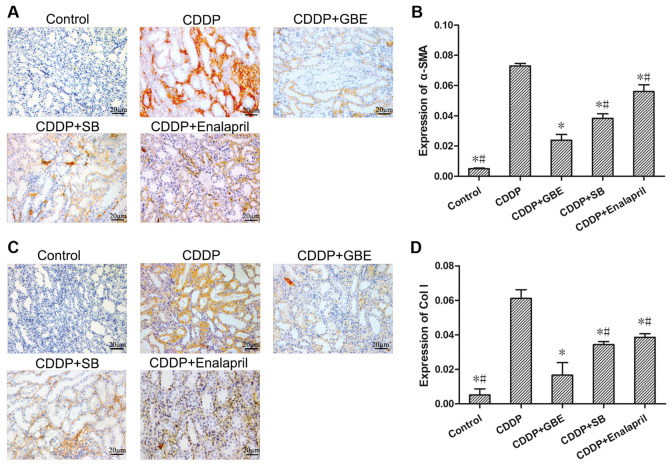
Figure 4.
Effect of GBE on α-SMA and Col I expression in rat renal tissues. α-SMA and Col I levels were detected using immunohistochemical staining. (A and C) Representative images of immunohistochemically stained renal tissue sections. Magnification, x400. α-SMA and Col I proteins were primarily expressed in renal tubular epithelial cells. Quantitative analysis of the expression levels of α-SMA (B) and Col I (D) in renal tissues. Data are presented as the mean ± standard deviation. n=9. *P<0.05 vs. CDDP group, #P<0.05 vs. CDDP + GBE group. GBE, Ginkgo biloba extract; SB, SB203580; α-SMA, α-smooth muscle actin; Col I, collagen 1.

