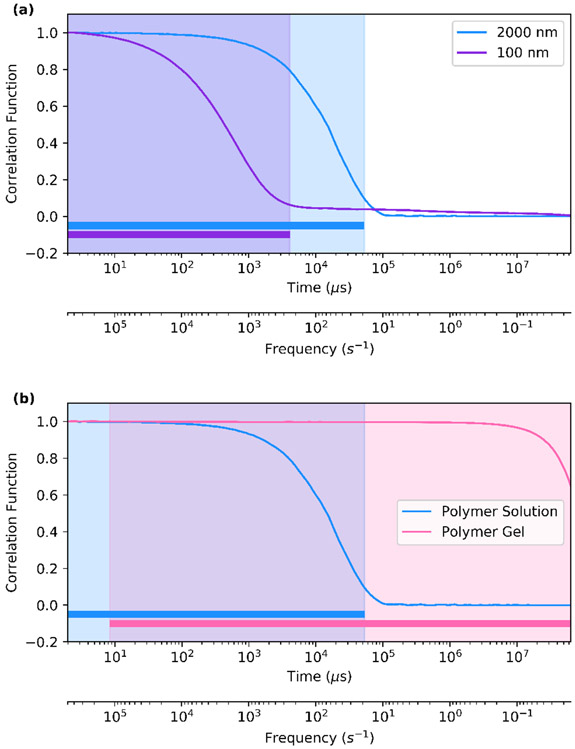
Fig. 2.
Comparison of the Correlation Functions for Different Materials. The correlation function shown here is the baseline subtracted and normalized intensity correlation function. (a) The correlation function corresponding to two different probe sizes in a 0.5 wt% solution of 700 kDa hyaluronic acid. The 2000-nm diameter particle exhibits a longer range of correlated motion than the 100-nm diameter particle, which results in a wider frequency range where the complex modulus can be found as denoted by the shaded region and solid bars at the bottom of the plot. (b) The correlation function corresponding to two different materials, where the polymer solution is a 0.5 wt% solution of 700 kDa hyaluronic acid and the polymer gel is a 5 wt% gel formed from 20 kDa 8-arm poly(ethylene glycol) crosslinked via thiol-vinylsulfone bonds.

