
Figure 1.
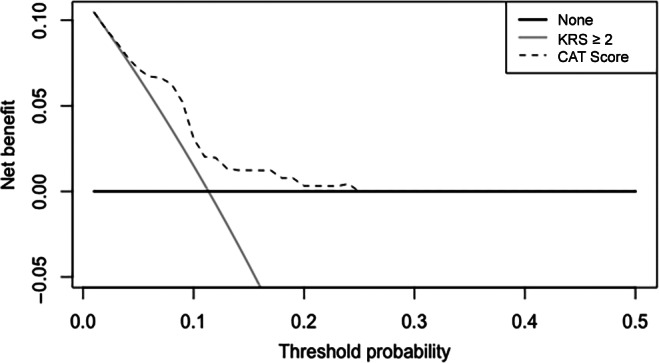
Decision curve analysis. A decision curve analysis among participants randomized to the placebo arm of the AVERT study. The net benefit (y‐axis) is calculated as the true positive rate minus the weighted false‐positive rate for venous thromboembolism and is demonstrated at a range of risk threshold probabilities (x‐axis—right truncated at 0.5). The dashed line demonstrates the net benefit for the use of the CATScore‐based selection for thromboprophylaxis, whereas the gray and black lines represent the net benefit of alternative strategies of the KRS of ≥2 (gray) or treating no one (black). Abbreviation: KRS, Khorana Risk Score.