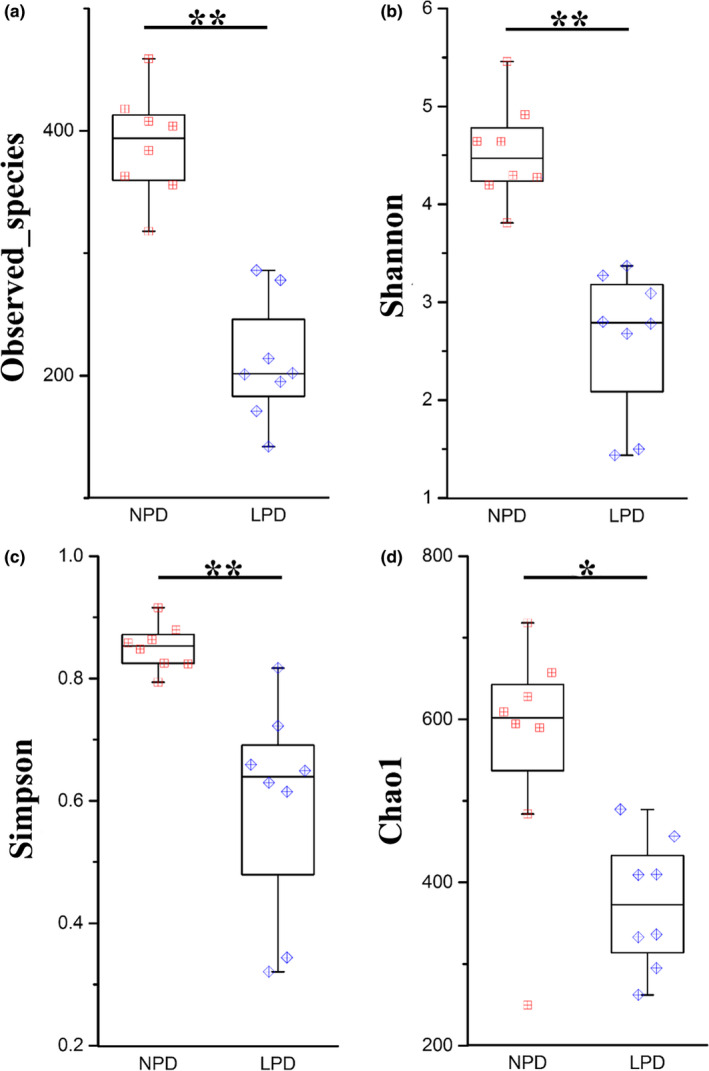
Figure 2.

Measures of alpha diversity for normal‐protein diet (NPD) and low‐protein diet (LPD) genetically improved farmed tilapia (GIFT). (a) Observed species, (b) Shannon's index, (c) Simpson's index, (d) chao1 index. Red, NPD GIFT; blue, LPD GIFT. * and ** indicate significant difference in abundance between dietary groups (Mann–Whitney U test, *:p < .05, **:p < .01)
