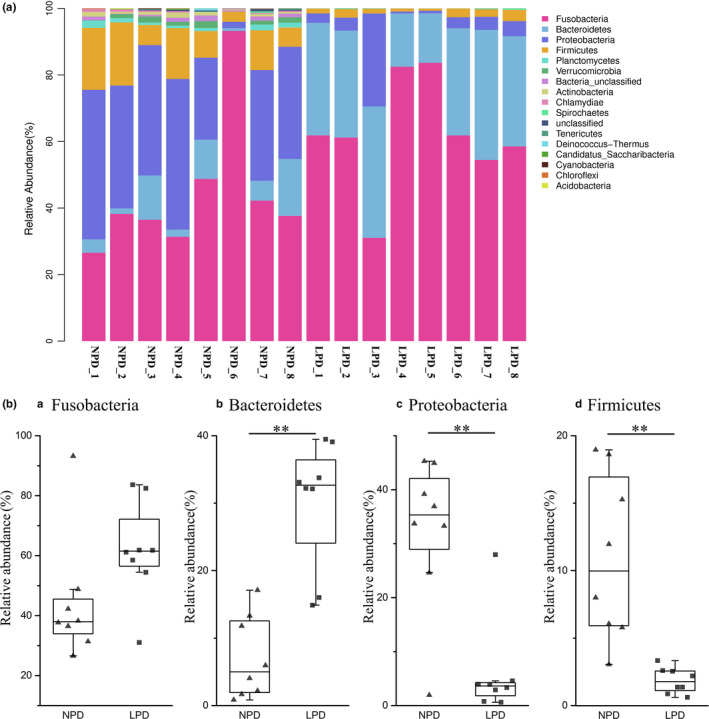
Figure 4.

(A) Relative abundance of predominant taxa identified at phylum level. Each bar represents relative abundance in each sample; 20 most abundant taxa are shown. (B) Abundance of bacterial phyla (a–d) in normal‐protein diet (NPD) and low‐protein diet (LPD) genetically improved farmed tilapia (GIFT). Black lines in box plots represent medians of relative abundance. ** indicates significant difference in abundance between dietary groups (Mann–Whitney U test, **:p < .01)
