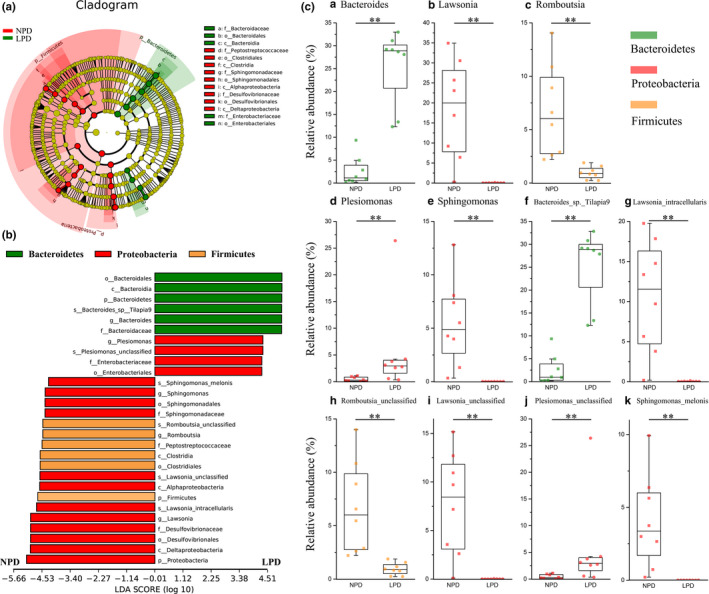
Figure 5.

Linear discriminant analysis effect size (LEfSe) analysis comparing abundance of all detected bacterial taxa between genetically improved farmed tilapia (GIFT) fed with a normal‐protein diet (NPD) and those fed with a low‐protein diet (LPD). (A) Taxonomic cladogram produced from LEfSe analysis. Red and green indicate taxa enriched in NPG and LPD GIFT, respectively. Brightness is proportional to abundance of each taxon. (B) Taxa shown in histogram were determined to differ significantly in abundance between diets by Kruskal–Wallis test (p < .05) and have LDA score >4. Bacterial taxa associated with positive LDA scores (right) were overrepresented in LPD GIFT, and those with negative scores (left) were overrepresented in NPD GIFT. Green: bacteria in phylum Bacteroidetes; Red: bacteria in phylum Proteobacteria; Yellow: bacteria in phylum Firmicutes. (C) Abundance of selected bacterial genera (a–e) and species (f–k) in NPD and LPD GIFT. Black lines in box plots represent medians of relative abundance. Mann–Whitney U test was used to determine significance of differences between groups (**, p < .01)
