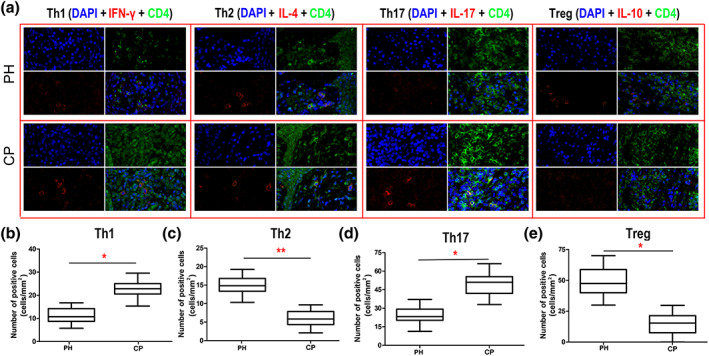
Figure 5.

Immunofluorescence assay for Th1/Th2/Th17/Treg cells in gingival tissue of the two groups (periodontally healthy [PH]: n = 22, chronic periodontitis [CP]: n = 35). (a) The top four immunofluorescence images are from healthy gingival tissue, and the bottom four images are from the CP group. CD4 is marked by green fluorescence, the indicated proteins are marked by red fluorescence, and the cell nucleus is marked by blue fluorescence. Polarization levels of (b) Th1, (c) Th2, (d) Th17, and (e) Treg in gingival tissues. ** p < .01 and * p < .05 indicate significant differences between the PH group and the CP group. NS p > .05 indicates that there is no significant difference between the two groups
