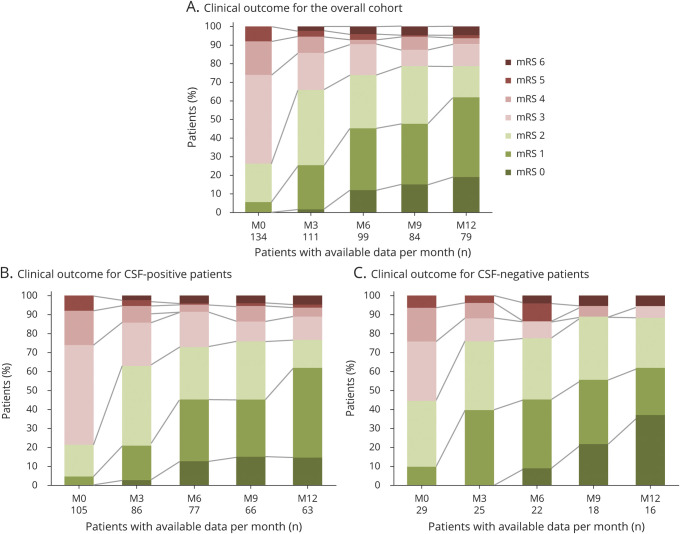
Figure 2. Evolution of Disability (mRS) With Long-term Follow-up.
Data shown only for the first 12 months of follow-up for the overall cohort (A; n = 134), and for patients with CSF-positive (B; n = 105), or CSF-negative (C; n = 29) for LGI1-Abs. Within every figure, abscissa axis indicates for each month the number of patients with available data, whereas ordinate axis represents the percentage of patients with a certain mRS score. LGI1-Abs = antibodies against leucine-rich glioma-inactivated 1 protein; M = month; mRS = modified Rankin Scale.

