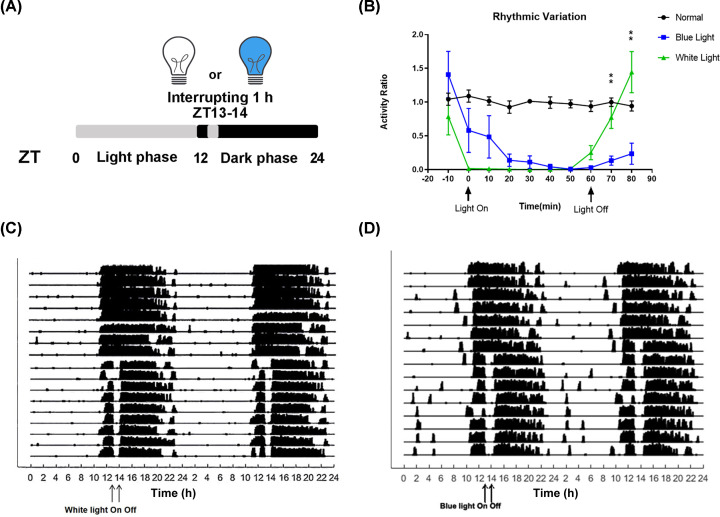
Figure 1. Blue light induces delays in both sleep and arousal-promoting responses.
(A) Inserted white and blue illumination (470 nm, 720 lux) patterns for wheel-running recording. (B) The activity ratios of four mice in each group (normal group, white light group and blue light group) during the middle five days were used for statistics. Except for the normal group, mice were exposed to white light or blue light for 1 h at ZT13 (0–60 min). Activity ratios are shown as the MEAN ± SEM. One-way repeated measures ANOVA for light condition during the first 10 min after finishing light exposure, F(2,9) = 17.29, P=0.0008. Posthoc Tukey blue versus white **P<0.01. One-way repeated measures ANOVA for light condition during the first 20 min after finishing light exposure, F(2,9) = 8.991, P=0.0071. Posthoc Tukey blue versus white **P<0.01. (C) Actogram of wheel running of mouse housed under a normal circadian rhythm of 12-h light/12-h dark for 7 days switched to a 12-h light/12-h dark cycle with a 1 h white light (C) or blue light (D) disturbance at ZT13-14 for 7 days.

