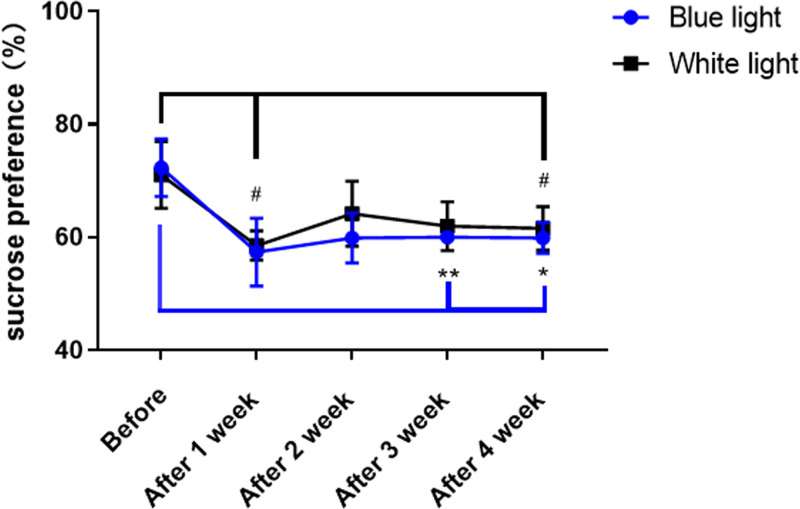
Figure 2. Sucrose preference test.
Mice exposed to white or blue light for 1 h at ZT13 exhibited disturbances for four continuous weeks, with both decreased sucrose preference scores. The sucrose preference ratio is shown as the MEAN ± SEM. Differences between 3 weeks after 1 h of blue light interference at ZT13 and normal circadian rhythm (t(3) = 5.988, **P<0.01) and 4 weeks (t(3) = 5.695, *P<0.05) after 1 h of blue light interference at ZT13 and normal circadian rhythm. Differences between 1 week (t(3) = 3.191, #P<0.05) or 4 weeks (t(3) = 3.58, #P<0.05) after 1 h of white light interference at ZT13 and normal circadian rhythm. The number of mice in each group was four.

