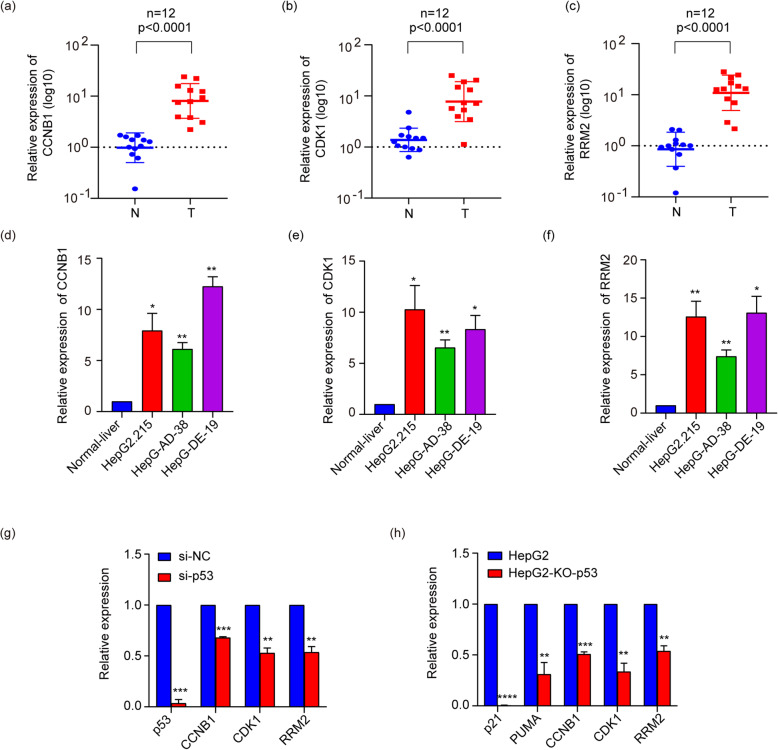
Fig. 7.
qRT-PCR results in liver tissues and liver cancer cell lines. The expression level of CCNB1, CDK1, and RRM2 in liver cancer tissues (a–c). All of three genes were significantly upregulated in tumor tissues compared with adjacent normal tissues (P < 0.0001). The expression level of CCNB1, CDK1, and RRM2 in HBV-related liver cancer cell lines (d–f). g Cells were transfected with negative control siRNA (si-NC) or siRNAs against p53(si-p53). h Knockdown of p53 HepG2 cells and HepG2 cells. Results indicated significant difference between groups (*P < 0.05, **P < 0.01, ***P < 0 .001, ****P < 0.0001).

