Fig. 2.
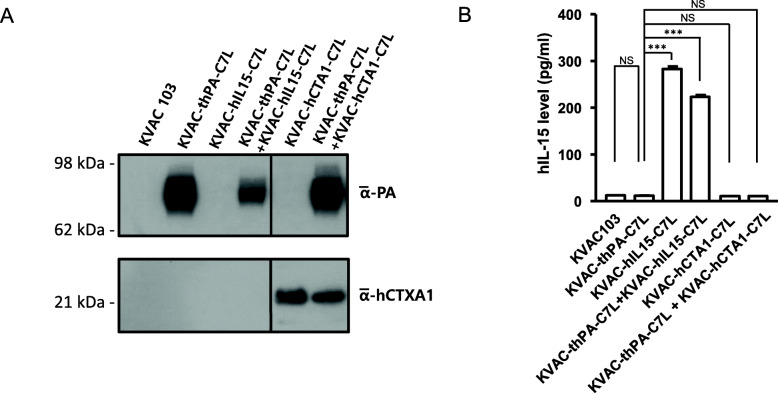
Expression of integrated proteins in vitro. a The expression of PA and CTA1 was detected by immunoblot assay in cell lysates. Vero cells were infected with KVAC-thPA-C7L and KVAC-CTA1-C7L for 48 h, and 50 μg of cell lysates from the infected cells were analyzed. The molecular weights from a size marker are indicated on the left. b The expression level of IL-15 was detected by ELISA. The IL-15 expression levels of infected Vero cells with KVAC103 derivatives were determined by the IL-15 ELISA kit (Biolegend). The bars on the graph indicates means of IL-15 expression levels from duplicated results in the same experiments, and the error bars stand for the standard error of the mean (***P < 0.001). NS, not significant. One-way ANOVA was applied for analysis

