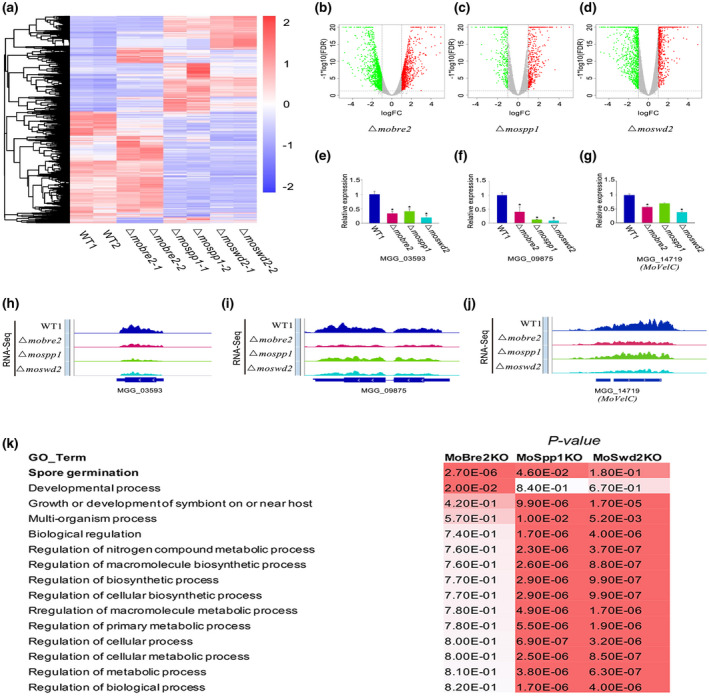
FIGURE 6.

The MoBre2, MoSwd2, or MoSpp1 gene deletion mutants exhibit gene expression decrease. (a) The heat map shows all the differentially expressed genes in wild types (WT) compared with three deletion mutants. (b–d) The differentially expressed genes are shown in volcano plots, the x axis shows the fold‐changes transformed by log2, and the y axis shows the false discovery ratio (FDR) transformed by − log10. (e–g) The read coverage shows that the expression signals of selected targets in spore germination in these three deletion mutants were significantly decreased compared with the wild‐type strain in some sample genes. (h–j) Quantitative reverse transcription PCR for spore germination genes shows the expression in WT decreased compared with knockouts (right panel). (k) Gene ontology (GO) term analysis of the candidate genes involved in mycelium development with H3K4me3‐ChIP‐seq peaks decreased in Δmobre2, Δmospp1, and Δmoswd2 mutants. The value shown on the table represents the frequency of the GO term in the GO annotation database. The colour represents the enrichment p value (Fisher's exact test) of each GO term. The scaled relative colour is shown in the heatmap
