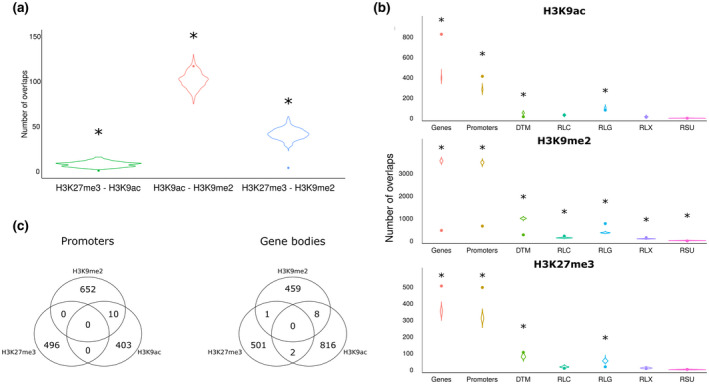
FIGURE 2.

Concurrence of histone marks detected in 3 days postinoculation Meloidogyne graminicola‐induced galls and uninfected root tips of rice plants. (a) Significance of overlap between histone peaks and different genic regions or transposable elements (TEs). The violin plots show the distribution of the number of overlapping histone peaks and randomly scattered TE or gene regions (1,000 simulations) and the dots the observed number. Asterisks indicate significant differences between the observed number and the random distribution (p < .05). (b) Similar to (a), but for the overlap between the different histone peaks. (c) Venn diagrams of the number of promoter regions and gene body regions shared between the three studied histone marks
