Figure 2.

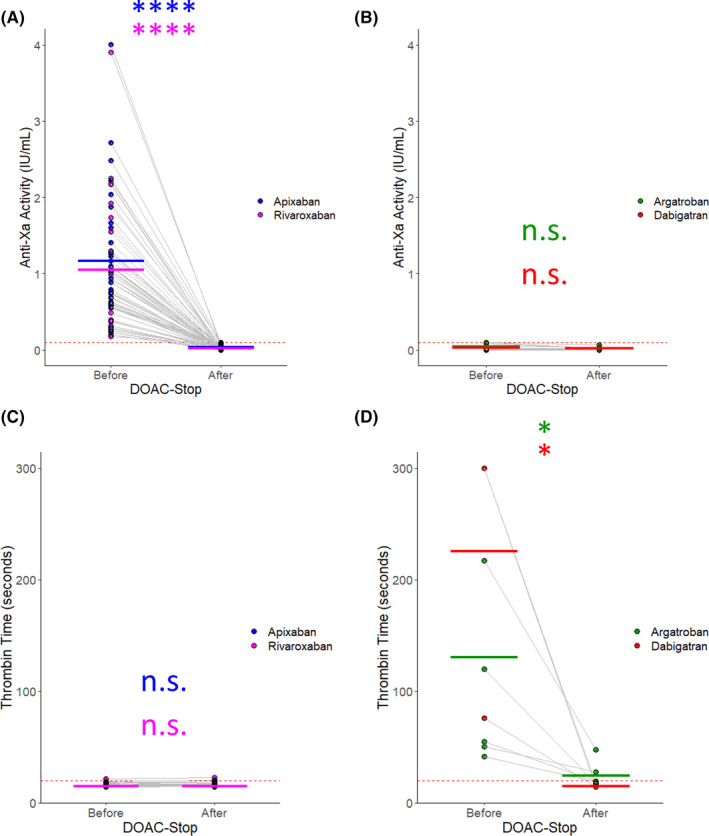
Anti‐Xa and TT results for samples treated with DOAC‐Stop. The samples from our test cohort were split into two aliquots; one was left untreated (“before”) and the other was treated with DOAC‐Stop per the manufacturer’s recommendation (“after”). The data are plotted for each sample tested. Each point represents an individual sample. The light gray lines connect the same sample Before and After treatment. The thick bars indicate the mean Before and After DOAC‐Stop treatment for each assay, colored by medication. The red dotted line indicates the upper threshold of the reference range/cut‐off for each assay. (A) The measured anti‐Xa activity before and after treatment with DOAC‐Stop in samples containing apixaban, blue, or rivaroxaban, purple, is plotted. (B) The measured anti‐Xa activity before and after treatment with DOAC‐Stop in samples containing argatroban, green, or dabigatran, red. (C) The measured TT for each sample containing apixaban or rivaroxaban colored as in (A). (D) The measured TT for each sample containing argatroban or dabigatran colored as in (B). n = 38 for apixaban. n = 26 for rivaroxaban. n = 6 for argatroban. n = 3 for dabigatran. * indicates P < .05; **** indicates P < .0001; n.s. indicates not significant by Student’s t test. DOAC, direct oral anticoagulant; TT, thrombin time
