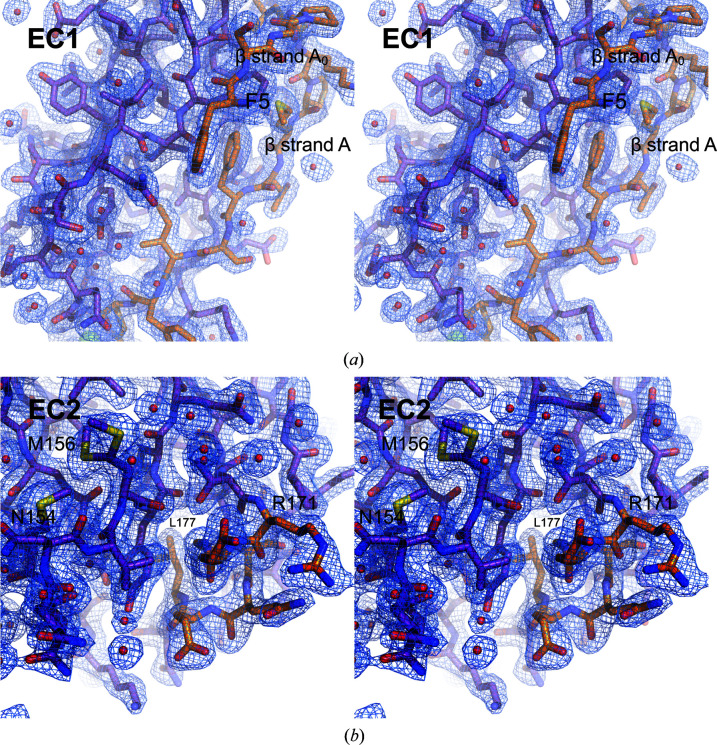
Figure 2.
Electron density (2F o − F c) for unique elements of hs CDH17 EC1–2. (a) Stereoview of EC1 detail showing β-strands A0 and A in orange, folded back against EC1. (b) Stereoview of the C-terminal side of EC2 with a two-turn α-helix, shown in orange. Residue Asn154 implicated in disease and a double conformer for residue Met156 are highlighted. Electron density is shown at 1σ with a carve radius of 1.6 Å. Red spheres indicate water molecules fitted in the electron density.

