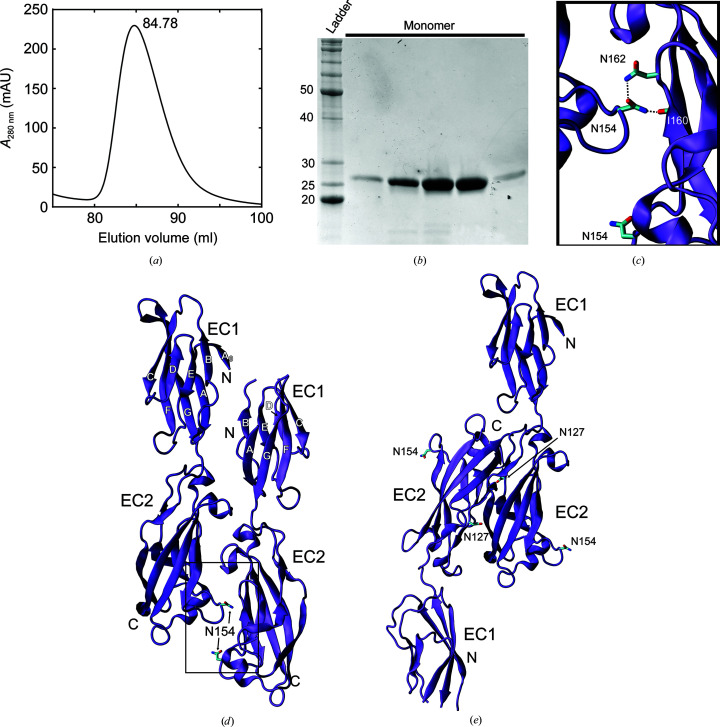
Figure 6.
Purification and crystal contacts for hs CDH17 EC1–2. (a) Elution profile of an SEC experiment for hs CDH17 EC1–2 showing a likely monomeric peak at an elution volume of 84.78 ml using a Superdex S200 column. (b) SDS–PAGE analysis of the hs CDH17 EC1–2 SEC peak. Lane 1 shows molecular-weight standards. Lanes 2–6 show fractions from the SEC peak. The band intensity corresponds to the peak intensity as equal volumes for each fraction were run on the gel. (c) Detail of the Asn154 residue implicated in disease (Smith et al., 2017 ▸) forming hydrogen bonds to residues Asn162 and Ile160. (d, e) Crystal contacts between two monomers of hs CDH17 EC1–2 as identified by PISA (Krissinel & Henrick, 2007 ▸). Residue Asn154, implicated in disease, is highlighted. A predicted N-glycosylation site, Asn127, is highlighted in (e). Interface areas are 582.9 Å2 (d) and 565.6 Å2 (e).

