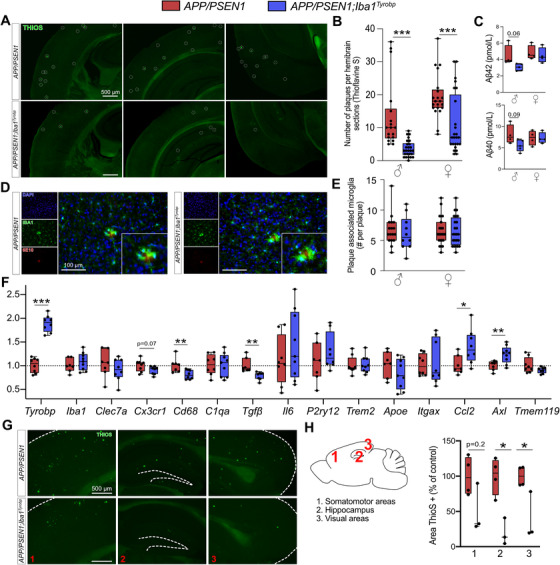
FIGURE 3.

Transgene‐derived Tyrobp upregulation decreases amyloid plaque load in APP/PSEN1 mice. A, Representative images of thioflavine‐S (ThioS) staining in APP/PSEN1 and APP/PSEN1;Iba1Tyrobp mice at 4 months of age. Scale bar = 500 μm. B, Quantification of the number of ThioS‐positive plaques per hemibrain in APP/PSEN1 and APP/PSEN1;Iba1Tyrobp mice at 4 months of age. N = 4–5 mice per genotype and sex with three slices per animal. C, Human amyloid beta (Aβ)42 and Aβ40 concentrations measured by enzyme‐linked immunosorbent assay in the cortices of the same groups described in (B). D, Representative images of double‐label immunohistochemistry with anti‐IBA1 and anti‐6E10 antibodies in APP/PSEN1 and APP/PSEN1;Iba1Tyrobp mice at 4 months of age. Scale bar = 100 μm. E, Quantification of the number of plaque‐associated microglia in the four groups described in (B). N = 10–24 plaques from 4–5 mice per group. F, Real‐time quantitative polymerase chain reaction analyses of microglial gene mRNAs in the hippocampi of APP/PSEN1 and APP/PSEN1;Iba1Tyrobp mice at 4 months of age. N = 7–9 mice per group, females and males were pooled. G, Representative images of ThioS staining in male APP/PSEN1 and APP/PSEN1;Iba1Tyrobp mice at 8 months of age. Scale bar = 500 μm. H, Quantification of the ThioS immunoreactive area in male APP/PSEN1 and APP/PSEN1;Iba1Tyrobp mice at 8 months of age (somatomotor and visual areas of the cortex, and hippocampus were quantified). N = 3–4 mice per group. Error bars represent means ± standard error of the mean. Statistical analyses were performed using a two‐way analysis of variance followed by a Sidak post hoc test for (B and E), a Kruskal‐Wallis test for (C), a Student t‐test for (F) and a Mann‐Whitney test for (H), *P < .05, **P < .01, ***P < .001
