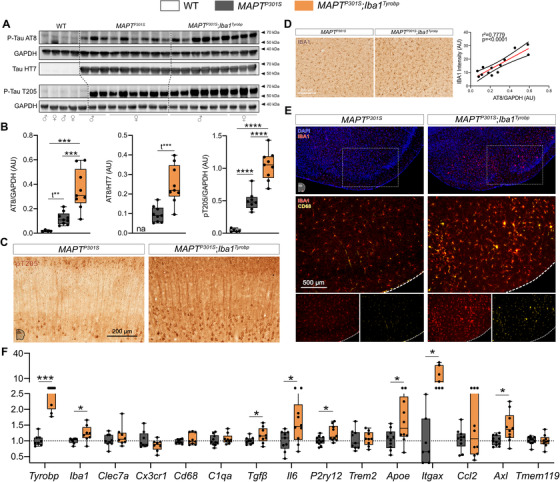
FIGURE 4.

Transgene‐induced Tyrobp upregulation increases apparent stoichiometry of TAU phosphorylation and microglial activation in 4‐month‐old MAPTP301S mice. A, Western blot analyses of phosphorylated TAU on S202 or T205 epitopes (AT8 and pT205 antibodies) and total human TAU (HT7 antibody) in cortical homogenates from wild‐type, MAPTP301S (PS19), and MAPTP301S;Iba1Tyrobp mice at 4 months‐old. n = 4–9 mice per group. B, Densitometric analyses of western blots presented in (A) standardized to GAPDH or HT7. C, Representative images of DAB‐immunohistochemistry with antibody pT205 in 4‐month‐old MAPTP301S and MAPTP301S;Iba1Tyrobp mice. Scale bar = 200 μm. D, Left panel: representative images of anti‐IBA1 immunohistochemistry on the same groups described in (C). Scale bar = 200 μm. Additional representative pictures are presented in Figure S2 in supporting information. Right panel: western blot‐AT8/GAPDH quantification plotted against anti‐IBA1 immunoreactivity in the cortex. Linear regression with trend line (red line) and 95% confidence intervals (black lines) are indicated. E, Representative images of double‐label immunofluorescence with anti‐IBA1 and anti‐CD68 antibodies in the piriform cortex on the same groups described in (C). Scale bar = 500 μm. F, Real‐time quantitative polymerase chain reaction analyses of microglial gene mRNAs in the hippocampus of MAPTP301S and MAPTP301S;Iba1Tyrobp mice at 4 months of age. N = 7–11 per group. Error bars represent means ± standard error of the mean. Statistical analyses were performed using a one‐way analysis of variance followed by a Tukey's post hoc test for (B) or a Student t‐test for (B) when *t is indicated and (F), *P < .05, **P < .01, ***P < .001, ****P < .0001
