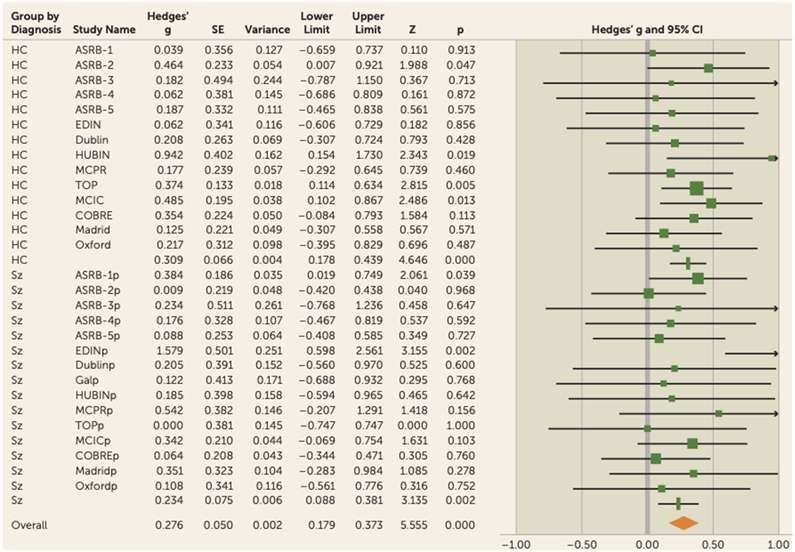
FIGURE 3. Forest plot for LA-gFA meta-analysis in a study of white matter microstructure and cognitive ability in schizophreniaa.
aThere was no significant difference between the observed effect size in patients compared with control participants (χ2=0.55, p=0.46). Effect values indicated with a vertical line are Hedges’ g group summaries for patients and control groups separately; the diamond represents summary statistics for the full sample. LA-gFA=fractional anisotropy component for six long association tracts; ASRB=Australian Schizophrenia Research Bank; COBRE=Center for Biomedical Research Excellence; EDIN=Edinburgh; HUBIN=Human Brain Informatics; MCIC=MIND Clinical Imaging Consortium; MPRC=Maryland Psychiatric Research Center; TOP=Thematically Organized Psychosis (TOP) NORMENT Research Study. In the lower half of the figure, the “p” appended to site names indicates the values relating to the patient cohort for each sample.

