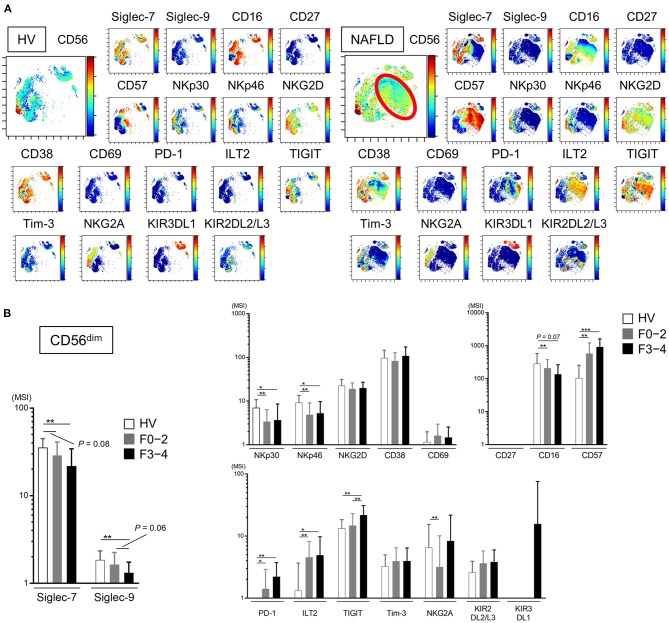
Figure 3.
Phenotypic characterization of peripheral blood NK cells from NAFLD patients. (A) Representative viSNE plots of peripheral blood NK cells (CD56+) from HVs and NAFLD patients. Left panels indicate the distribution of CD56-expressing cells. The red circle indicates the CD56dim NK subpopulation specifically detected in NAFLD patients. Right panels show expression of the indicated surface proteins among the NK cell subpopulations. The color scale indicates a gradient of high (red) to low (blue) expression level of the relevant protein. (B) Expression levels (MSI) of Siglecs and differentiation, activation, and inhibitory markers on CD56dim NK cells from HVs (n = 13) and NAFLD patients with F0–2 (n = 27) or F3–4 (n = 15). Data are presented as the means ± SD. *P < 0.05, **P < 0.01, ***P < 0.001 by the Mann–Whitney U-test. F0–2, liver fibrosis stage 0–2; F3–4, liver fibrosis stage 3–4; HV, healthy volunteer; MSI, median signal intensity; NAFLD, non-alcoholic fatty liver disease; Siglec, sialic acid-binding immunoglobulin-like lectin; tSNE, t-distributed stochastic neighbor embedding.

